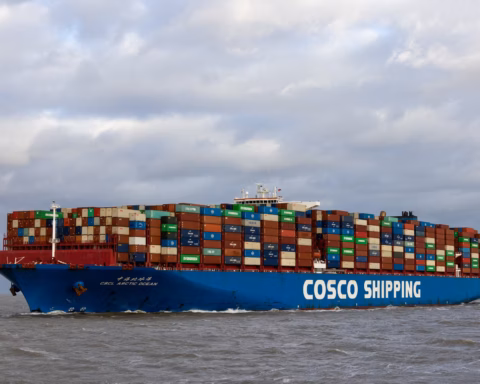

DOHA — The Strait of Hormuz crisis has removed roughly twenty percent of the world’s liquefied natural gas supply from international markets, triggering an energy emergency that threatens to inflict more lasting damage on the global economy than the parallel oil shock. QatarEnergy declared force majeure on LNG shipments in early March 2026 after Iranian drone strikes forced the shutdown of the Ras Laffan and Mesaieed liquefaction complexes, eliminating an estimated 5.8 million tonnes of LNG from the global supply chain in a single month. While crude oil can be rerouted through pipelines — Saudi Arabia has already pivoted exports to the Red Sea via the East-West pipeline to Yanbu — there is no pipeline alternative for liquefied natural gas. Every molecule of Qatari gas must travel by ship through the Strait of Hormuz, and the strait is closed.
The consequences are cascading across three continents. Asian spot LNG prices have spiked sixty percent. India’s LPG crisis is particularly acute, with 90 per cent of the country’s cooking gas imports cut off at source. European gas futures have doubled. Japan, which holds barely two weeks of LNG reserves, faces the most acute electricity shortfall since the Fukushima disaster. India’s largest gas buyers have failed to secure a single spot cargo. And the crisis will outlast the war itself, because Qatar’s liquefaction plants cannot be restarted overnight — the full ramp-up will take months, not weeks.
Table of Contents
- What Happens When the World’s Biggest LNG Producer Goes Dark?
- How Much Gas Actually Flows Through the Strait of Hormuz?
- The Gas Vulnerability Index
- Why Does Japan Face the Most Dangerous Energy Shortage Since Fukushima?
- South Korea’s Forty-Day Countdown
- Europe’s Second Energy Crisis in Four Years
- Can the United States Fill the Qatar Gap?
- The Spot Market Bloodbath
- Saudi Arabia’s Jafurah Gambit
- What Does the LNG Crisis Mean for Global Electricity Prices?
- Why the Gas Shortage Will Outlast the War
- Frequently Asked Questions
What Happens When the World’s Biggest LNG Producer Goes Dark?
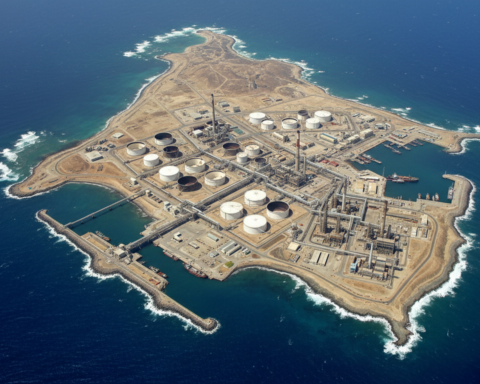
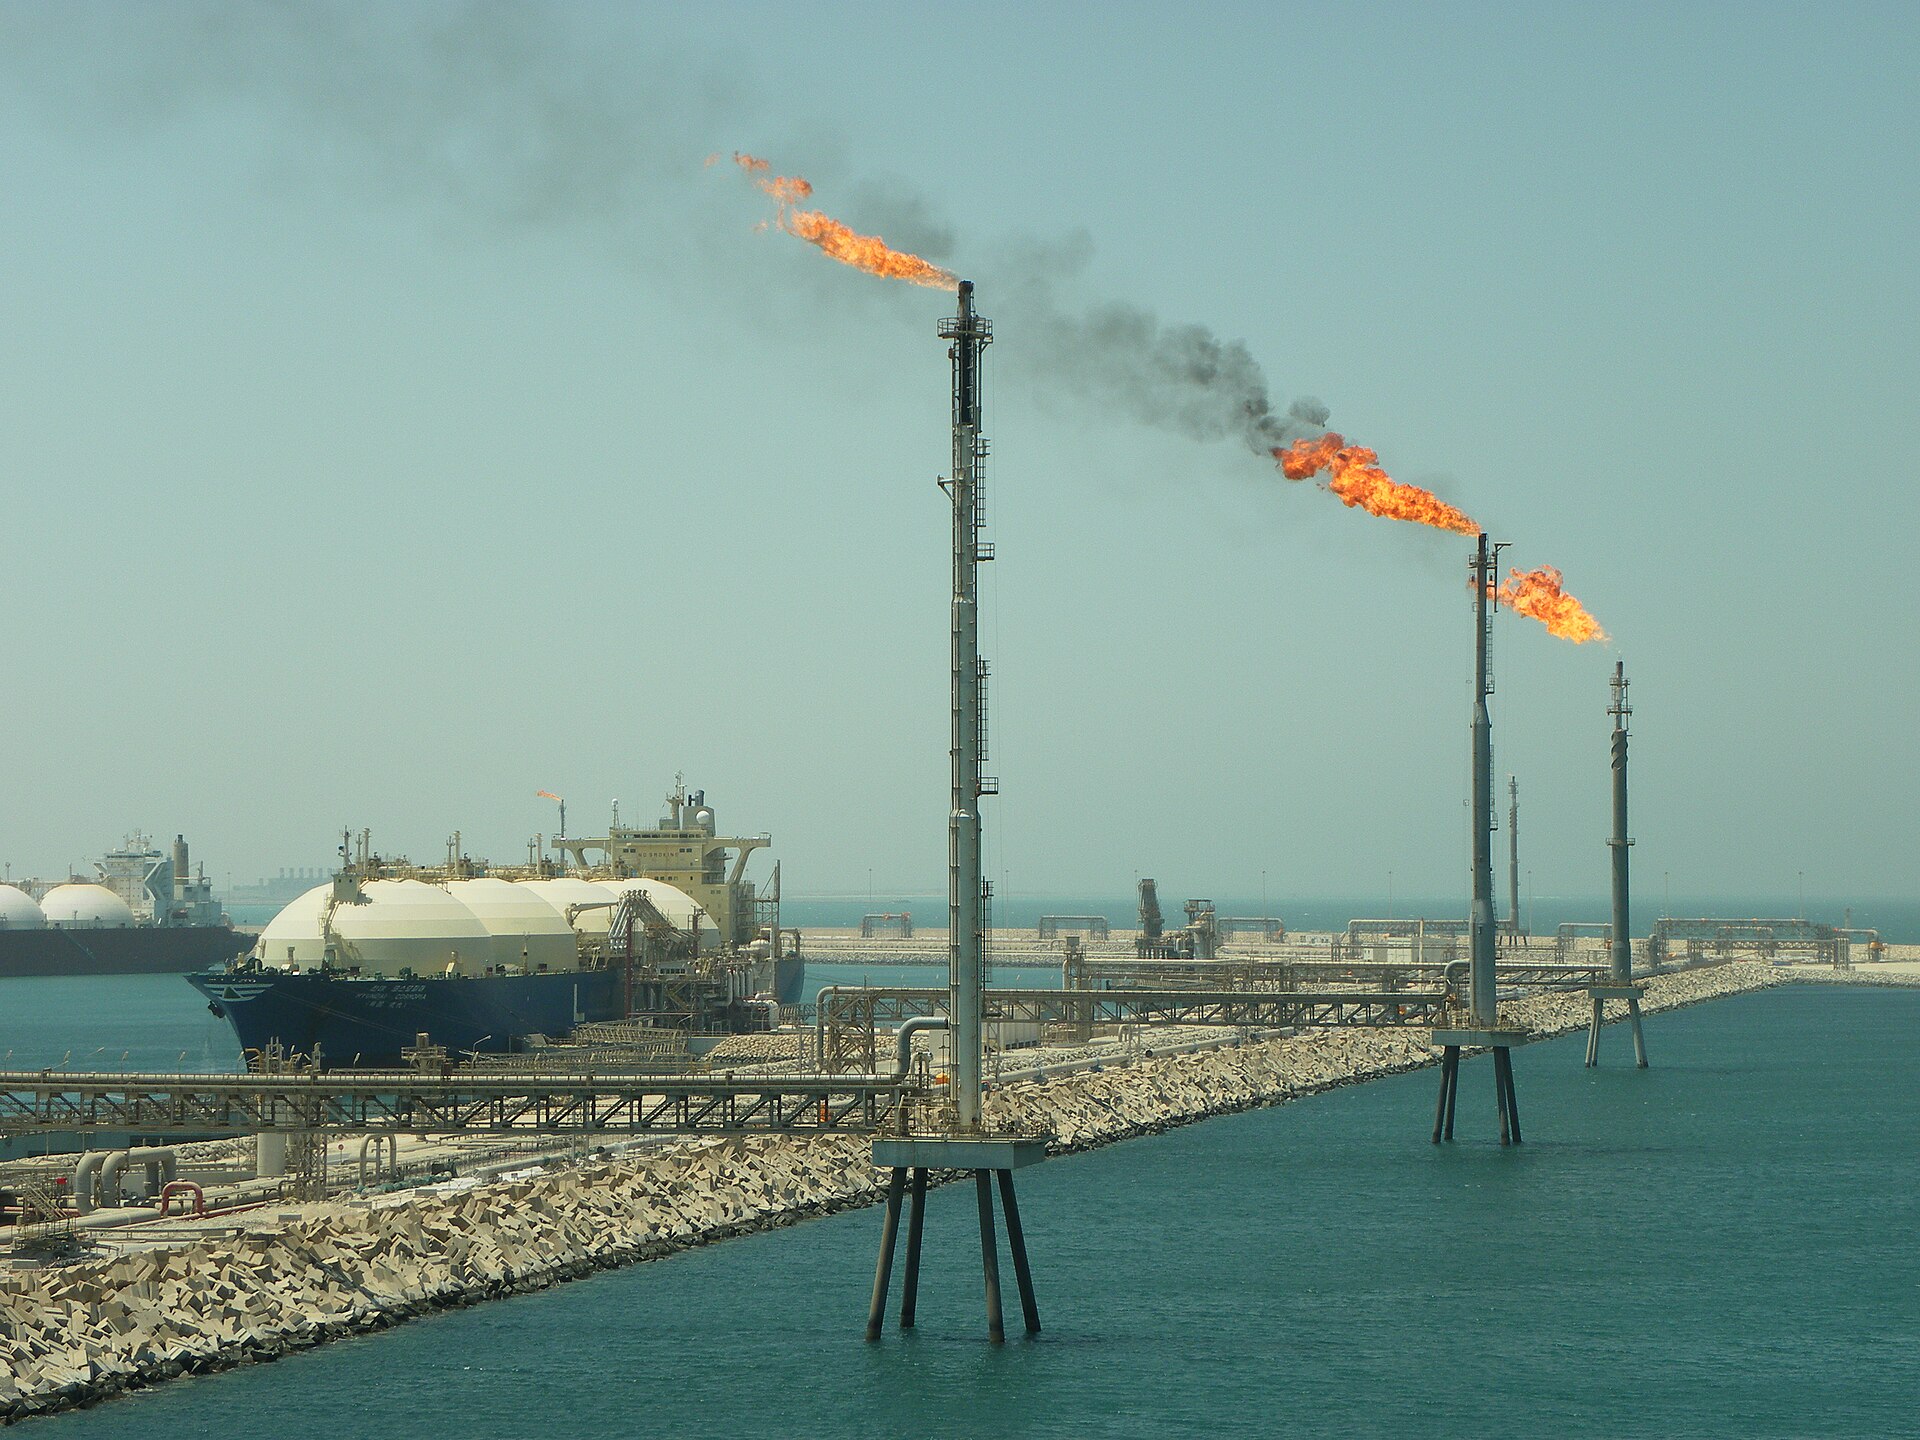
Qatar produces approximately 77 million tonnes of liquefied natural gas per year, making it the second-largest LNG exporter after the United States. Ras Laffan Industrial City, the vast complex north of Doha where most of that gas is liquefied and loaded onto carriers, is the single most important node in the global gas trade. When QatarEnergy ceased operations at Ras Laffan and its smaller Mesaieed facility in early March, it was the first time the entire Qatari liquefaction system had ever been taken fully offline.
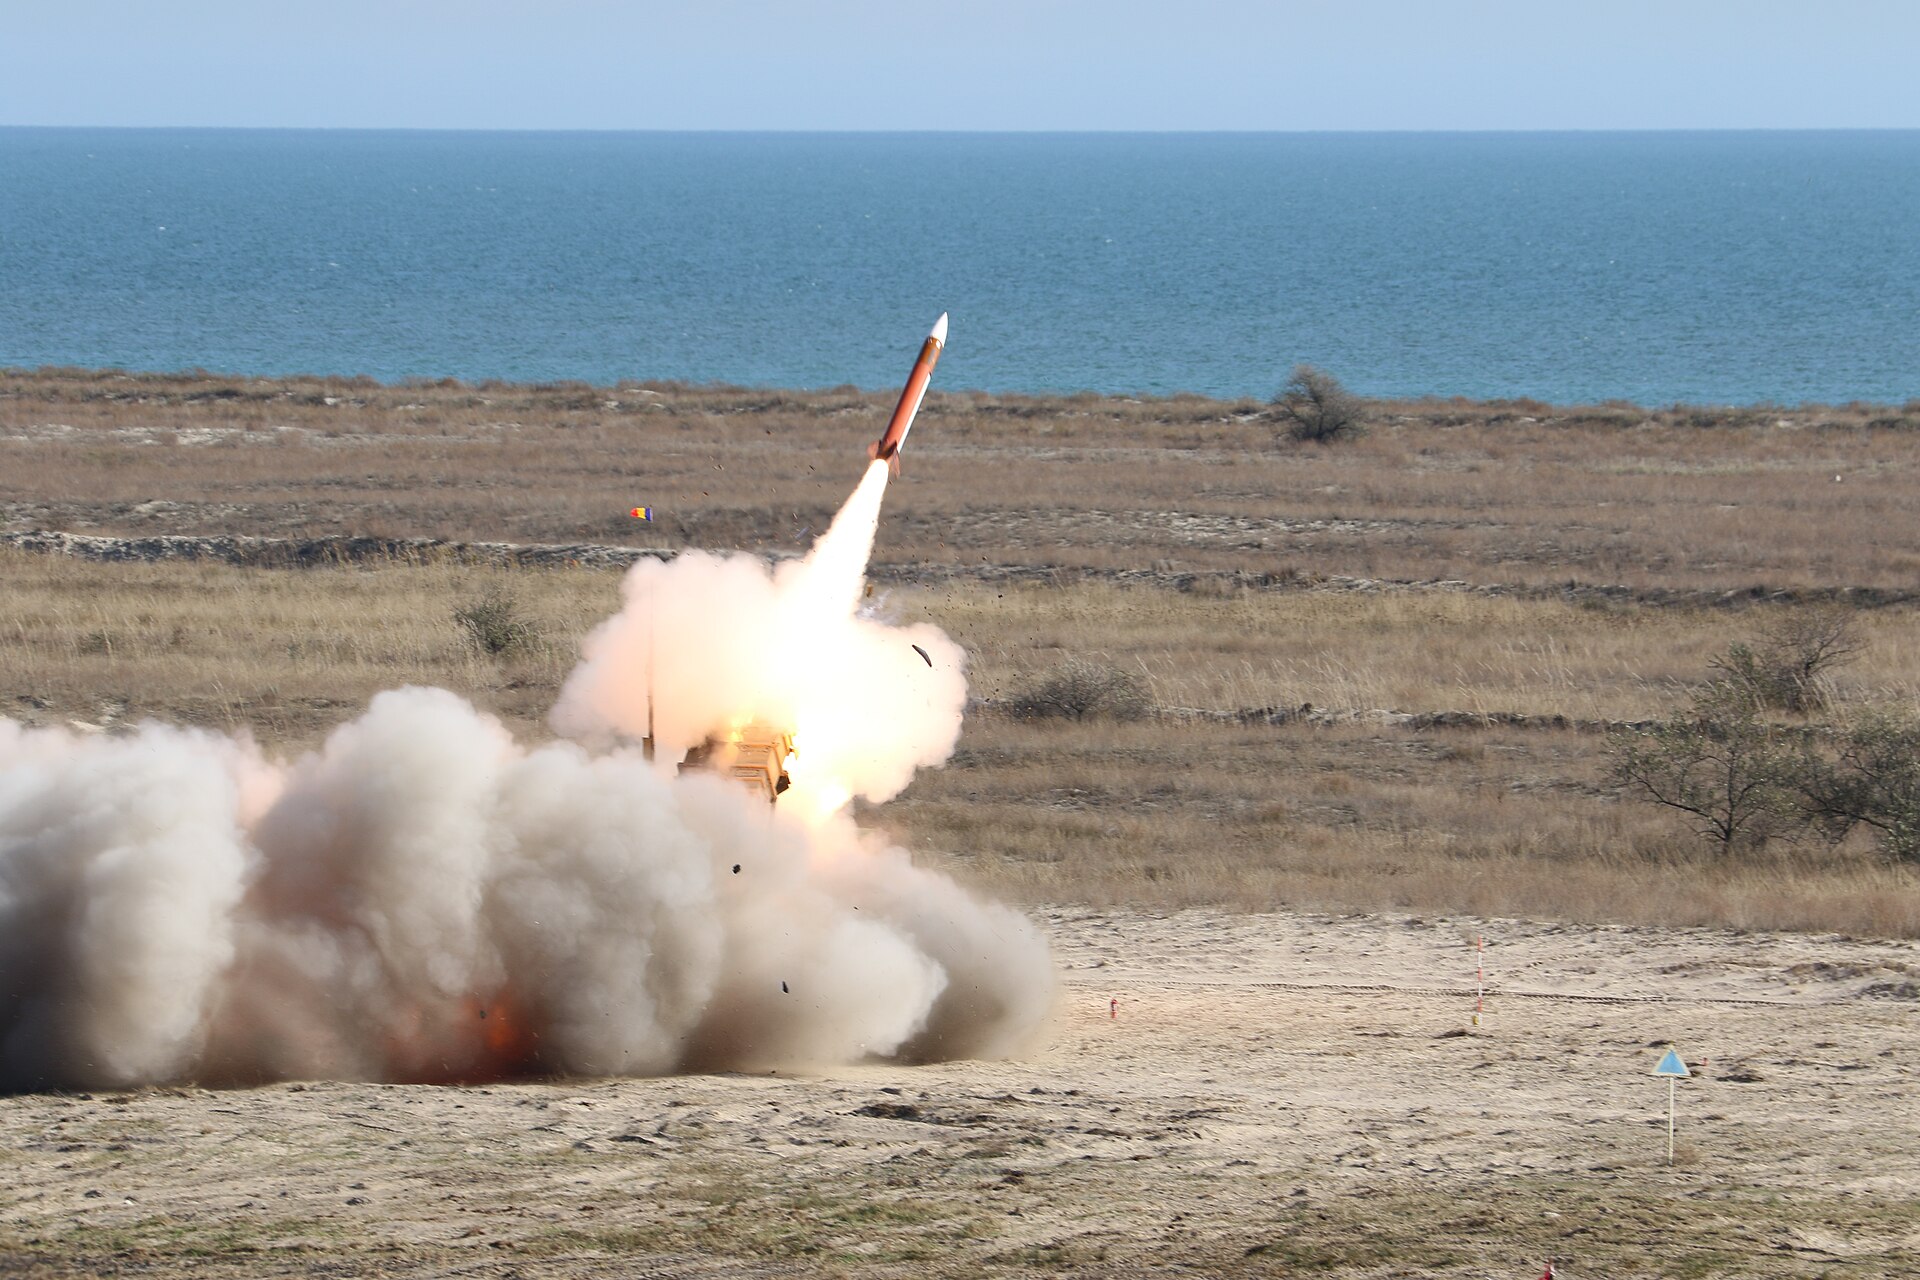
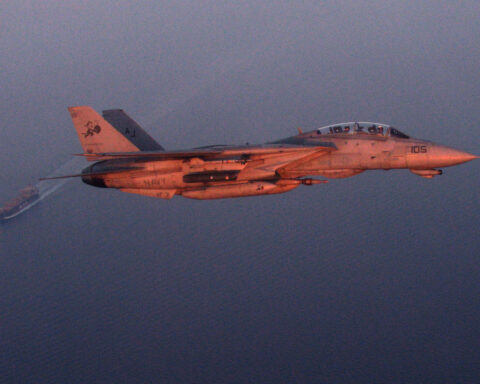
The shutdown was not voluntary. Iranian drone strikes on Gulf infrastructure, part of Tehran’s retaliatory campaign following the assassination of Ali Khamenei, struck targets near Qatar’s export facilities. The IRGC’s campaign against gas infrastructure has since extended to the UAE, where a drone strike on Abu Dhabi’s Shah sour gas field on 16 March set the ADNOC-Occidental processing complex ablaze, confirming that Tehran views gas production facilities as high-value targets alongside export terminals. Though the liquefaction trains themselves were not directly hit, the Islamic Revolutionary Guard Corps issued navigation warnings prohibiting vessel passage through the Strait of Hormuz, and protection and indemnity insurance was withdrawn for vessels transiting the waterway. No LNG carrier has exited the strait since the conflict began.
The scale of the disruption dwarfs any previous supply interruption in the history of the LNG industry. The 5.8 million tonnes removed from the March supply forecast represents a catastrophic fourteen percent reduction in global monthly output, according to Kpler. Unlike crude oil, where Saudi Arabia’s pipeline network has partially offset the Hormuz closure by redirecting millions of barrels to Red Sea terminals, LNG has no bypass infrastructure. Gas must be liquefied at the source, loaded onto specialised cryogenic carriers, and shipped directly to regasification terminals. There is no equivalent of the East-West pipeline for molecules cooled to minus 162 degrees Celsius. The March 18 missile strike on Ras Laffan confirmed this fundamental asymmetry — the destruction of the world’s largest LNG complex left no bypass route and a reconstruction timeline measured in years, not months.
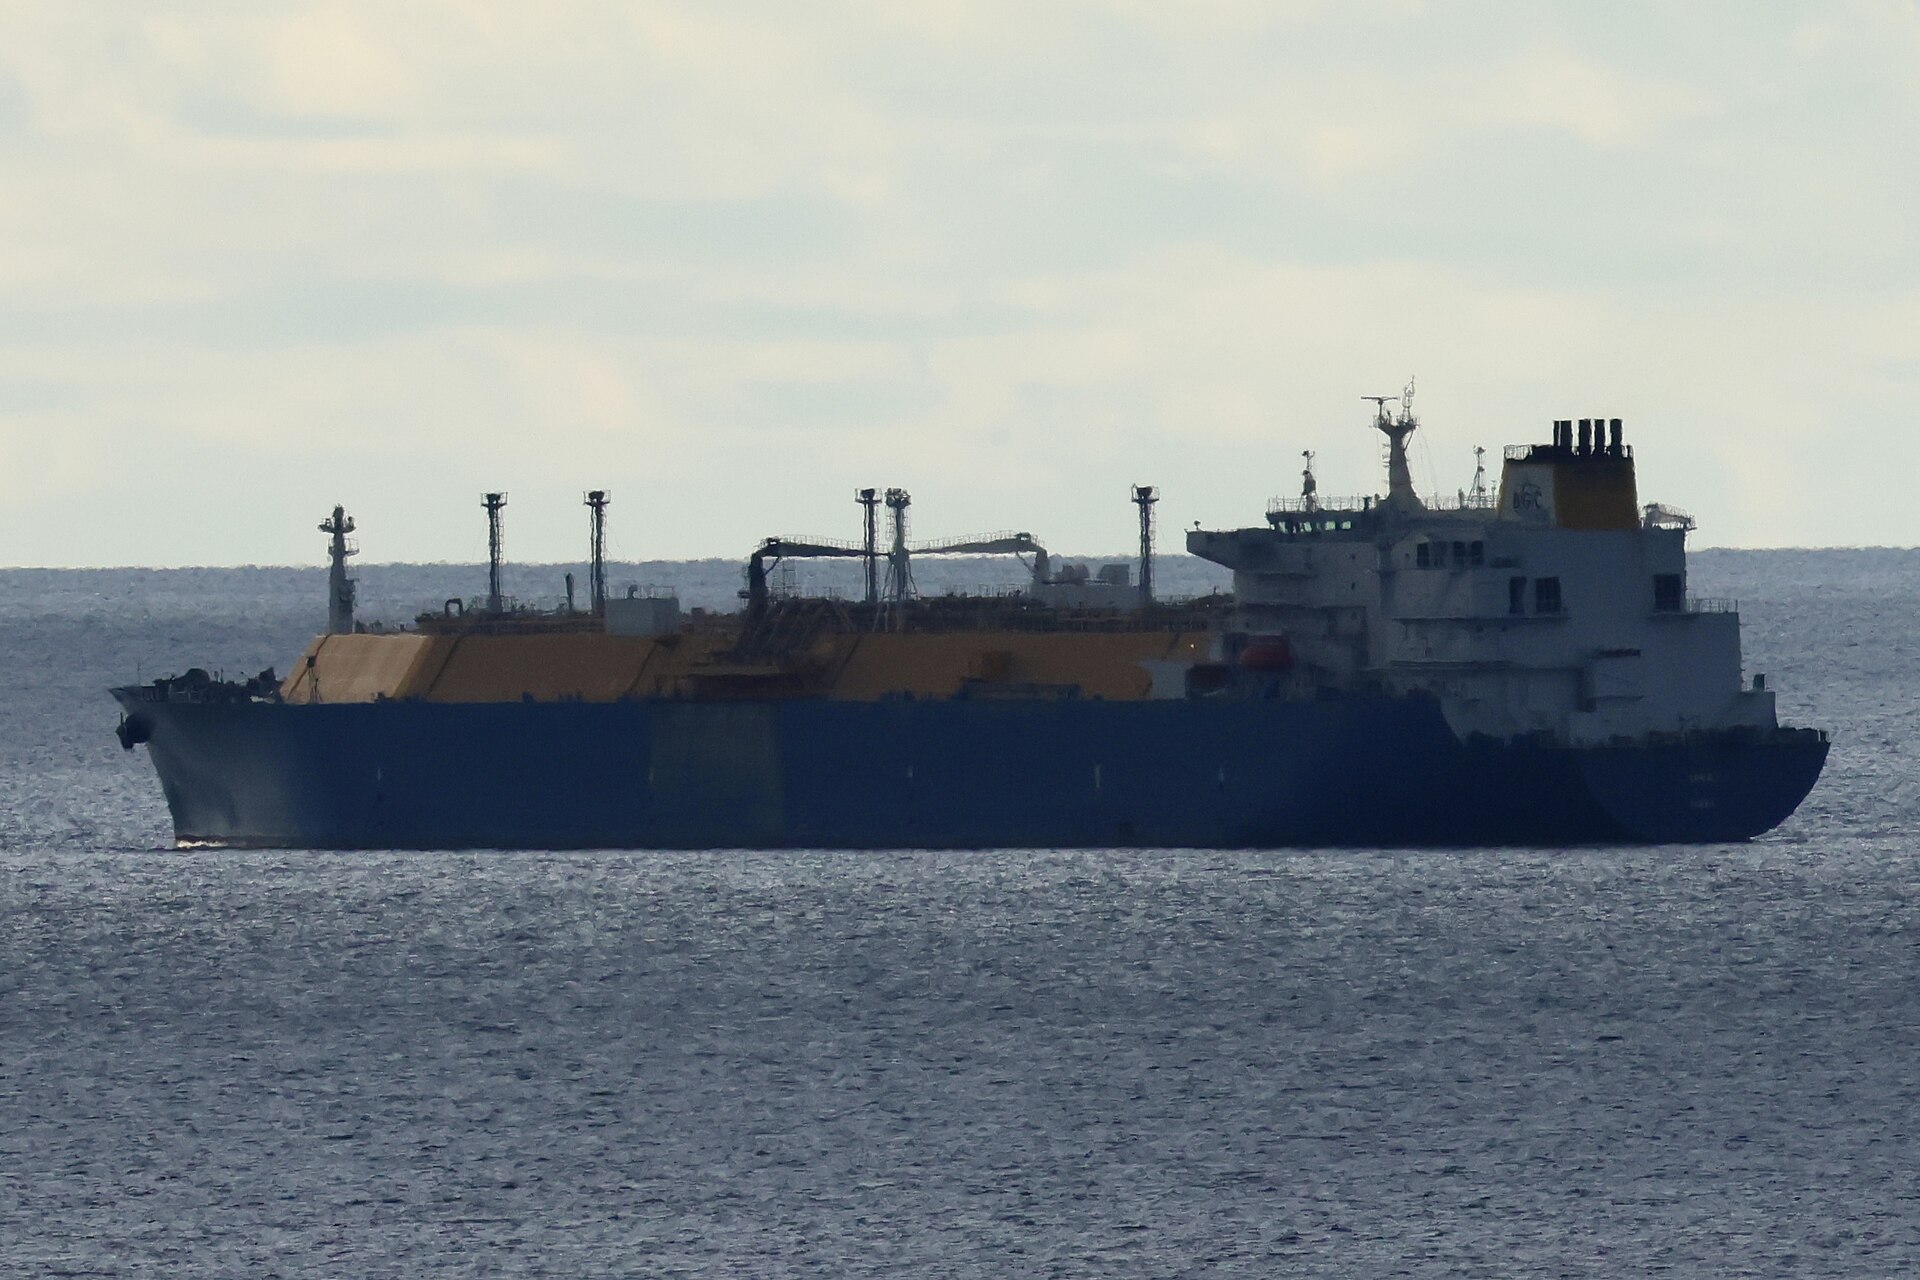
The difference between oil and gas in a Hormuz crisis comes down to physics. Crude oil is a liquid at ambient temperature. It can flow through pipelines, be stored in tank farms, and loaded at any deepwater port. Natural gas must be cooled to cryogenic temperatures, compressed into one six-hundredth of its original volume, and transported in specialised vessels costing upwards of $200 million each. The entire supply chain — from wellhead to regasification terminal — is rigid, inflexible, and uniquely vulnerable to chokepoint disruptions.
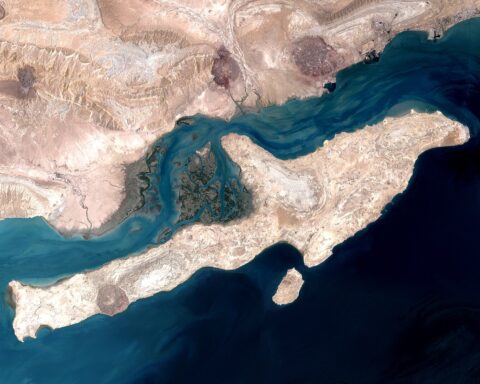
How Much Gas Actually Flows Through the Strait of Hormuz?
Approximately twenty percent of the world’s LNG trade passes through the Strait of Hormuz in any given year, according to the U.S. Energy Information Administration. Nearly all of this volume originates from Qatar, though small quantities come from the United Arab Emirates. In 2025, Qatar exported roughly 80 million tonnes of LNG, with the vast majority loaded at Ras Laffan and shipped through the strait to buyers in Asia, Europe, and South America.
The numbers acquire a different weight when examined by destination. Qatar supplies approximately thirty percent of the LNG consumed in South Korea. It provides nearly a quarter of Japan’s LNG imports. It accounts for ten percent of Europe’s LNG supply, a share that has grown since the continent weaned itself off Russian pipeline gas following the 2022 invasion of Ukraine. For individual European countries, the dependency is sharper: Belgium, Italy, and Poland rely on Qatari LNG for a disproportionate share of their gas imports, according to Euronews analysis.
| Metric | Value | Source |
|---|---|---|
| Share of global LNG through Hormuz | ~20% | EIA, 2026 |
| Qatar LNG exports (2025) | ~80M tonnes | QatarEnergy |
| Monthly shortfall from shutdown | 5.8M tonnes | Kpler, March 2026 |
| Reduction in global monthly forecast | 14% | Kpler, March 2026 |
| LNG carriers exiting Hormuz since crisis | 0 | Bloomberg shipping data |
| Qatar share of global LNG exports | ~19% | IEA, 2025 |
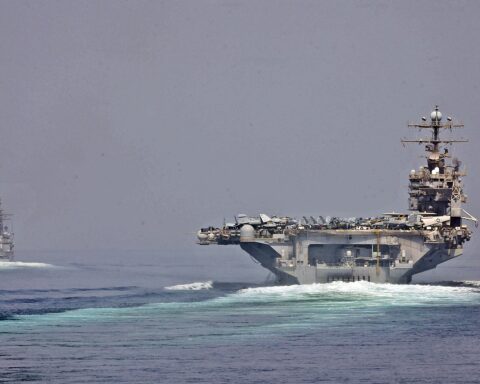
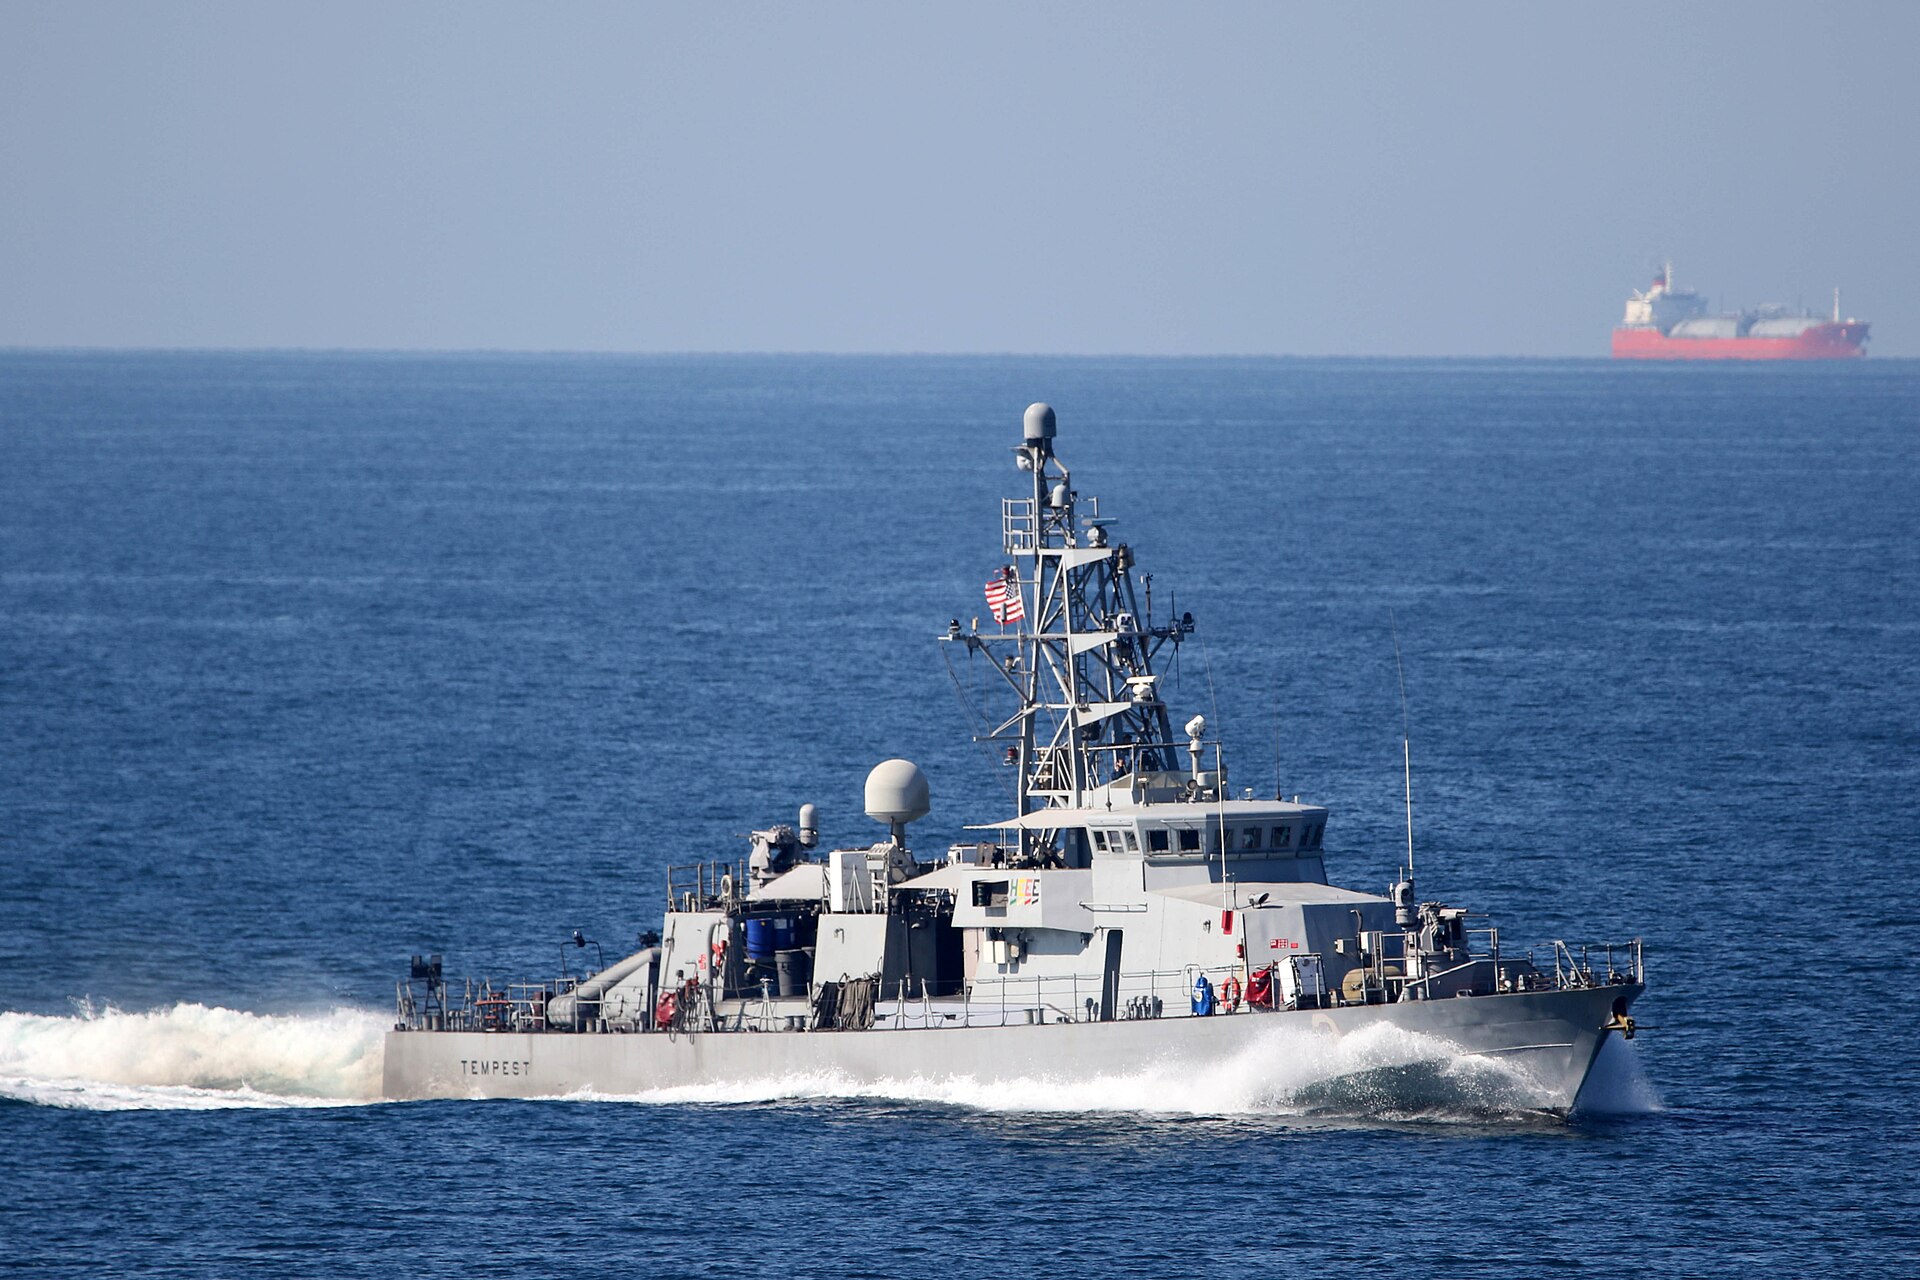
The chokepoint vulnerability has been understood for decades. Military planners, energy analysts, and insurers have warned since the 1980s that any closure of the Strait of Hormuz would cripple global gas markets. What those warnings consistently underestimated was the speed at which the market would seize. Within forty-eight hours of the IRGC’s navigation prohibition, every LNG tanker in the Persian Gulf had either diverted or anchored. The withdrawal of P&I insurance made the economic risk too high for any ship owner to attempt a transit, regardless of military escort availability.
The strait is only thirty-four kilometres wide at its narrowest point. LNG carriers, which can be over three hundred metres long, must navigate a channel that is simultaneously threatened by Iranian anti-ship missiles, sea mines — an estimated 5,000 of which have been deployed — and drone boats. Even if a military convoy could clear a safe passage, no commercial insurer will underwrite the cargo.
The Gas Vulnerability Index
The impact of the LNG crisis varies enormously by country. Nations with diversified gas supplies — pipeline connections to multiple producers, domestic production, ample storage — face inconvenience and higher prices. Nations dependent on seaborne LNG from a single region face electricity rationing, industrial shutdowns, and economic contraction. The divergence is the most consequential energy asymmetry of the conflict.
Three factors determine a country’s exposure: dependency on Gulf LNG as a share of total gas supply, days of strategic gas reserves, and availability of alternative supply sources such as domestic production or pipeline imports. The interplay of these variables produces starkly different outcomes for different economies.
| Country | Gulf LNG Share of Gas Supply (%) | Days of LNG Reserves | Alternative Sources | Vulnerability Rating |
|---|---|---|---|---|
| Japan | 22-25 | 14-28 | Australia, US LNG, limited nuclear restarts | Critical |
| South Korea | 28-32 | 9-52 | Australia, US LNG, minimal pipeline | Critical |
| Pakistan | 35-40 | 7-10 | Domestic production (declining), Iran pipeline (suspended) | Extreme |
| Bangladesh | 45-50 | 5-7 | Domestic reserves (depleting) | Extreme |
| India | 15-18 | 12-20 | Domestic production, US LNG, Australia | High |
| Thailand | 12-15 | 15-25 | Myanmar pipeline, domestic offshore | Elevated |
| Italy | 8-10 | 45-60 | Algeria pipeline, Norway, TAP pipeline | Moderate |
| Germany | 3-5 | 35-50 | Norway pipeline, US LNG, FSRUs | Low-Moderate |
| United Kingdom | 4-6 | 10-15 | Norway pipeline, domestic North Sea | Moderate |
| China | 8-10 | 30-45 | Turkmenistan pipeline, Russia pipeline, domestic | Moderate |
The index reveals a pattern that contradicts the dominant narrative of the Hormuz crisis. Media coverage has focused overwhelmingly on oil, which generates dramatic price movements and affects petrol stations that voters notice. The gas crisis operates differently. It does not produce long queues at filling stations. It produces blackouts, factory closures, and fertiliser shortages — slower, less visible, and ultimately more destructive.
Pakistan and Bangladesh sit at the extreme end of the vulnerability spectrum. Both nations were already struggling with chronic gas shortages before the war. Pakistan’s domestic gas production has declined by roughly thirty percent over the past decade, leaving the country increasingly dependent on imported LNG. Bangladesh’s proven reserves are depleting rapidly, and its two floating storage regasification units receive almost all their cargoes from Qatar. For these countries, the Hormuz shutdown is not an energy inconvenience. It is an existential threat to industrial output and electricity generation.
Why Does Japan Face the Most Dangerous Energy Shortage Since Fukushima?
Japan is the world’s second-largest LNG importer, purchasing roughly 65 million tonnes in 2025. Between seventy-five and ninety percent of Japan’s total oil imports transit the Strait of Hormuz, according to Japan’s Ministry of Economy, Trade and Industry, and a substantial portion of its LNG arrives via the same waterway. Japan holds approximately 150 days of crude oil in strategic reserves, a buffer that provides meaningful insulation from the oil shock. For LNG, the picture is dramatically different.
Japan’s LNG reserves cover between two and four weeks of consumption. The gas is used primarily for electricity generation — natural gas-fired power plants produce roughly thirty-seven percent of Japan’s electricity — and for industrial processes including steel manufacturing, chemical production, and ceramics. When those reserves are depleted, the alternatives are limited. Japan restarted several nuclear reactors after Fukushima, but nuclear power still accounts for less than ten percent of the country’s electricity. Renewable energy contributes approximately twenty-two percent but is insufficient to fill a shortfall of the magnitude now emerging.
The country’s energy planners face a scenario they have studied obsessively but never experienced. Japan’s ten regional electric power companies have begun implementing conservation measures, including requests for industrial customers to reduce electricity consumption by fifteen to twenty percent. Tokyo Electric Power Company (TEPCO) and Chubu Electric have reportedly begun discussions about rolling blackouts in the event that gas reserves drop below ten days’ supply.
“Japan has the financial resources to bid for any spot cargo on the market, but there are simply not enough cargoes available. This is not a price problem. It is a physics problem.”Chris Wheaton, Stifel Energy Analyst, March 2026
The parallel with Fukushima is instructive but imperfect. After the 2011 disaster, Japan shut down all fifty-four nuclear reactors and replaced the lost generation capacity with imported LNG, sending spot prices to record highs above $19 per MMBtu. The current crisis reverses the equation: the LNG itself is unavailable, and the nuclear capacity that might substitute for it was dismantled over the previous decade. Japan’s energy vulnerability is a consequence of choices made over fifteen years, and no emergency measure can reverse those choices in fifteen days.
South Korea’s Forty-Day Countdown
South Korea’s exposure mirrors Japan’s in structure but differs in specifics. The country sources roughly sixty percent of its crude oil through the Strait of Hormuz and depends on Gulf LNG for approximately thirty percent of its natural gas supply, according to the Korea Energy Economics Institute. The government maintains that strategic LNG reserves could last between nine and fifty-two days, a range so wide it reveals more about the uncertainty of the situation than about actual preparedness.
Korea Gas Corporation (KOGAS), the world’s largest LNG buyer, holds term contracts with QatarEnergy covering approximately 12 million tonnes annually. Those contracts are now suspended under force majeure. KOGAS has scrambled to secure replacement cargoes from the United States, Australia, and Oman, but the global spot market has tightened to the point where available cargoes are being contested by bidders from three continents simultaneously.
South Korea’s semiconductor industry, which generates over $170 billion in annual revenue and supplies chips to global technology supply chains, depends on uninterrupted gas supplies for its fabrication plants. Samsung Electronics and SK Hynix have both acknowledged that extended gas rationing could force production curtailments at their chip fabrication facilities, a development that would ripple through the global electronics industry. The irony is sharp: a conflict in the Persian Gulf, triggered by an assassination in Tehran, could cause smartphone and laptop shortages in New York, London, and Tokyo.
Seoul has opened discussions with Washington about prioritising LNG deliveries from the new Plaquemines and Golden Pass terminals in Louisiana and Texas, but even with presidential intervention, contract renegotiation takes weeks, and rerouting tankers from their existing destinations creates shortfalls elsewhere.
Europe’s Second Energy Crisis in Four Years
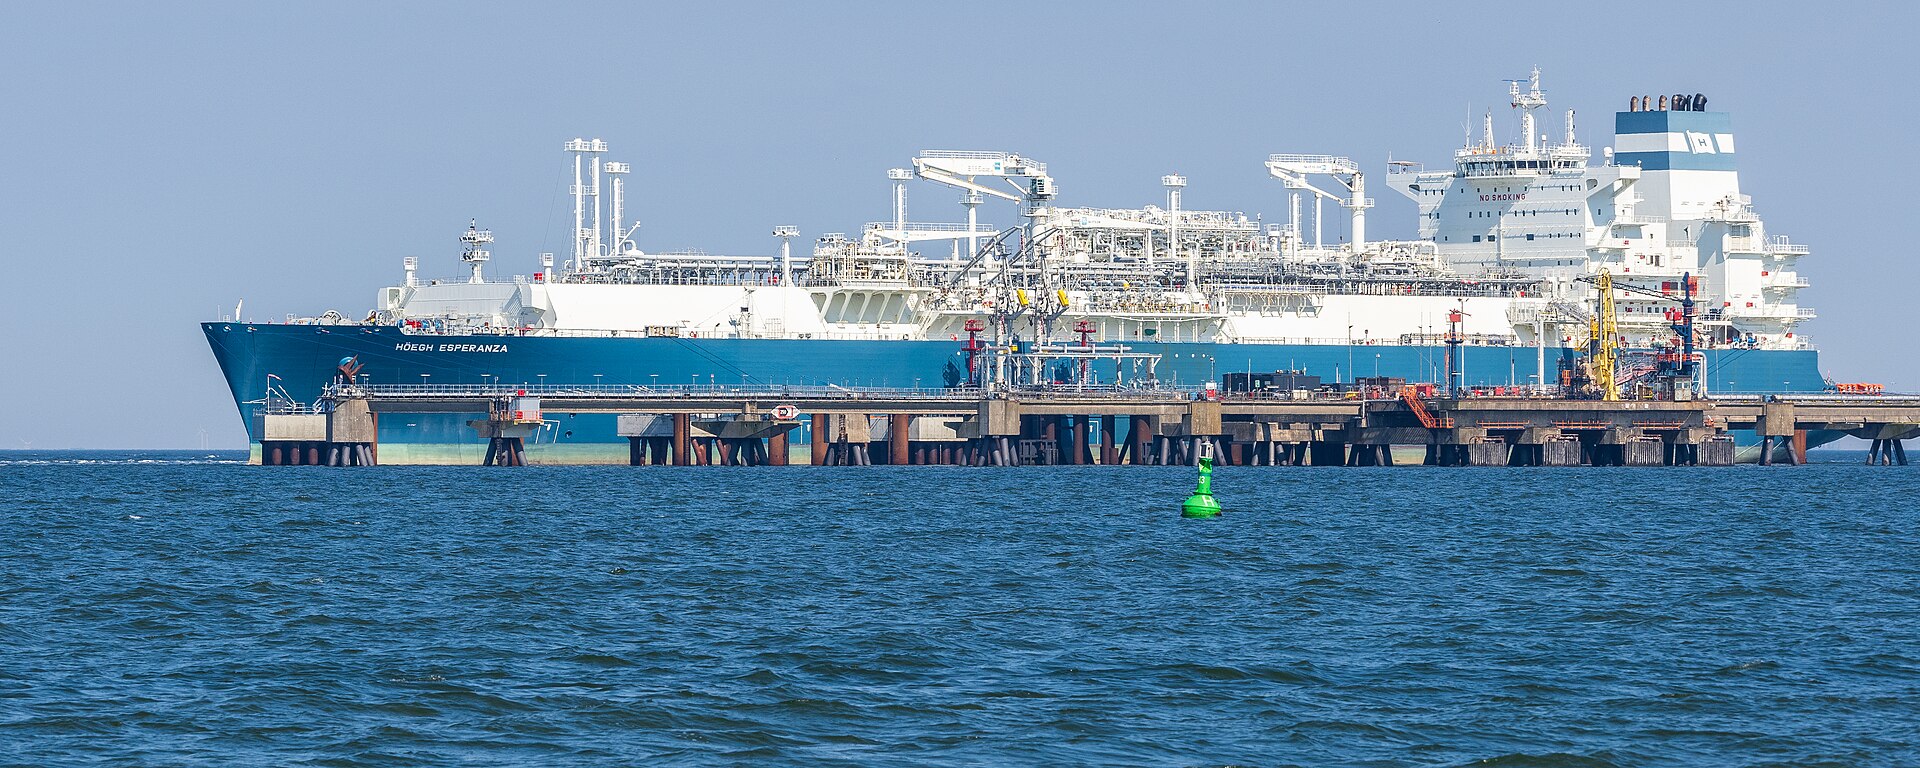
Europe entered the Hormuz crisis in worse condition than any policymaker publicly acknowledged. Gas storage levels across the European Union stood at approximately 46 billion cubic metres at the end of February 2026, compared to 60 billion in 2025 and 77 billion in 2024, according to Gas Infrastructure Europe data. The drawdown reflected a colder-than-average winter, reduced Norwegian pipeline flows due to maintenance, and increased competition with Asian buyers for spot LNG cargoes throughout the fourth quarter of 2025.
Qatar provides approximately ten percent of Europe’s LNG imports. The immediate mathematical impact of losing that supply is manageable for the continent as a whole — American LNG, which now constitutes the majority of European seaborne gas imports, continues to flow uninterrupted. Norwegian pipeline gas, which supplies roughly a quarter of European demand, remains stable. But the aggregate numbers conceal dangerous national disparities.
Belgium receives a disproportionate share of its LNG through the Zeebrugge terminal, which handles Qatari cargoes under long-term contracts. Italy’s Adriatic LNG terminal processes significant volumes from the Gulf. Poland’s Swinoujscie terminal, built explicitly to reduce dependence on Russian gas, was designed to receive Qatari LNG. For these countries, the Hormuz shutdown creates genuine supply gaps that cannot be filled by simply redirecting American or Norwegian molecules.
| Metric | Value | Comparison |
|---|---|---|
| EU gas storage (end February 2026) | 46 bcm | 60 bcm (2025), 77 bcm (2024) |
| Qatar share of EU LNG imports | ~10% | Up from 7% in 2021 |
| TTF price increase since crisis began | +76% | Over €60/MWh vs €34 pre-war |
| Cargoes diverted from Europe to Asia | 9+ | Bloomberg ship-tracking, March 2026 |
| US LNG share of EU imports | ~45% | Up from 28% in 2021 |
The deeper threat to Europe is not the direct loss of Qatari supply but the second-order effects on the global spot market. At least nine LNG cargoes initially bound for European terminals have been diverted to Asia since the fighting began, according to Bloomberg ship-tracking data, because Asian buyers are offering higher prices. This is a repeat of the 2022 dynamic, when European importers had to outbid Japanese and Korean buyers for every available cargo during the Russian gas crisis. The difference now is that the surplus capacity which cushioned Europe in 2022 — American terminals ramping up, new Australian projects coming online — has been absorbed by normal demand growth. There is no slack in the system.
The European Commission convened emergency energy coordination meetings on March 5 and emphasised that the continent was not facing an imminent crisis. That assessment relies on two assumptions: that Norwegian pipeline flows remain stable, and that the conflict ends quickly enough for gas storage to be refilled before the next European winter. If the war continues through the summer refilling season, Europe will enter winter 2026-2027 with dangerously depleted reserves, recreating the conditions that produced rolling industrial shutdowns in Germany and energy poverty spikes across Southern Europe in the winter of 2022-2023.
Moscow has not missed the opportunity. Russian officials have publicly offered to resume pipeline gas deliveries to European customers, a proposition the European Commission dismissed as a “strategic blunder” on March 11, according to CNBC. But the offer exposes a painful reality: Europe’s post-Russia energy security architecture was built on the assumption that diversification into LNG — primarily from the United States, Qatar, and North Africa — would provide permanent insulation from supply weaponisation. The Hormuz crisis demonstrates that seaborne gas is vulnerable to its own chokepoints, and that replacing one form of dependency with another is not the same as achieving energy independence.
Can the United States Fill the Qatar Gap?
The United States exported a record 111 million tonnes of LNG in 2025, surpassing the 100-million-tonne threshold for the first time and confirming its position as the world’s largest LNG supplier — roughly 20 million tonnes ahead of Qatar. The Biden-era pause on new LNG export terminal approvals was reversed by the Trump administration, and two major new facilities — Plaquemines LNG and Golden Pass — are ramping up production in 2026, adding approximately 4 billion cubic feet per day of export capacity.
The temptation is to conclude that American gas can simply replace Qatari supply. The reality is more complicated. U.S. export plants are already running at near-maximum capacity, with utilisation rates above ninety percent. The 5.8 million tonnes of monthly supply removed by Qatar’s shutdown exceeds the total additional capacity coming online from new American terminals in 2026. Even if every new molecule of American LNG were directed to markets affected by the Hormuz closure — which contractual obligations prevent — the gap would remain.
Geography compounds the problem. An LNG cargo from Sabine Pass, Louisiana to Incheon, South Korea requires approximately twenty-five days of transit time through the Panama Canal. The same voyage from Ras Laffan takes roughly twelve days via the Strait of Hormuz. Replacing Gulf supply with American supply doubles the number of tanker-days required per delivered tonne, effectively halving the fleet’s carrying capacity at a time when no new LNG carriers can be built quickly enough to matter. The global LNG fleet consists of approximately 700 vessels, and construction of a new carrier takes three to four years.
| Country | Annual Capacity (M tonnes) | Utilisation Rate (%) | Spare Capacity (M tonnes) |
|---|---|---|---|
| United States | ~120 | 92-95 | 6-10 |
| Australia | ~88 | 90-95 | 4-9 |
| Qatar (pre-crisis) | ~80 | 97-100 | 0 (offline) |
| Russia | ~33 | 85-90 | 3-5 |
| Malaysia | ~30 | 85-90 | 3-5 |
| Nigeria | ~22 | 60-70 | 7-9 |
| All other | ~65 | 70-80 | 13-20 |
Australia, the third member of what the energy industry calls the “LNG Trinity,” faces similar constraints. Most Australian liquefaction plants — including Gorgon, Wheatstone, and the North West Shelf — are operating at or near full capacity. Australia supplied roughly thirty percent of Asian LNG imports in the first half of 2025, and its plants have no meaningful ability to ramp up production in the short term. The gas is there in the ground, but the liquefaction infrastructure is the bottleneck.
Kpler estimates that realistic supplementary supply from all alternative sources globally totals under 2 million additional tonnes per month — against a 5.8-million-tonne monthly shortfall. The arithmetic is unforgiving. Even with maximum effort from every non-Qatari producer, the world will remain short by approximately 4 million tonnes of LNG per month for as long as the Hormuz closure continues. That is not a gap that can be managed through efficiency measures or demand destruction. It is a physical shortfall that will force choices about which countries get gas and which do not.
The Spot Market Bloodbath
The LNG spot market has experienced its most violent price dislocation since the European energy crisis of 2022. The Asian Japan Korea Marker (JKM), the benchmark price for spot LNG deliveries in Northeast Asia, spiked nearly sixty percent in the first week of March to over $25 per million British thermal units. The European TTF benchmark surged past €60 per megawatt-hour, a level roughly double its pre-war price on February 27.
LNG tanker daily freight rates jumped more than forty percent in the first week of the crisis, according to shipping brokers, as charterers scrambled to secure vessels for emergency supply diversions. Time charter rates for modern LNG carriers, which averaged approximately $65,000 per day in January 2026, climbed above $120,000 per day by the second week of March. The freight surge is itself inflationary — every dollar added to shipping costs is ultimately passed to the end consumer.
The spot market’s dysfunction is not merely a matter of price. India’s largest gas buyers — GAIL and Gujarat State Petroleum Corporation (GSPC) — issued emergency tenders for spot LNG cargoes in early March and received zero offers, according to Reuters. The cargoes simply do not exist. Sellers with uncommitted supply are directing it to the highest bidder, and buyers in South and Southeast Asia who lack the financial firepower of Japanese or Korean utilities are being priced out entirely.
Bangladesh, which operates two floating storage regasification units that receive virtually all their LNG from Qatar, has been forced to secure replacement cargoes at prices reportedly three to four times higher than its term contract rates. The cost differential threatens to blow apart the country’s electricity tariff structure, which was already strained by the broader energy price environment. Dhaka faces a choice between accepting punishing spot prices and implementing load-shedding — scheduled blackouts that were a chronic feature of Bangladeshi life before LNG imports began in 2018.
Saudi Arabia’s Jafurah Gambit
The LNG crisis has illuminated an aspect of Saudi Arabia’s economic strategy that has received insufficient attention: the Kingdom’s own transformation into a major gas producer. Aramco began production at the Jafurah unconventional gas field in December 2025, the first output from a project that represents the largest shale gas development outside the United States. The field holds estimated reserves of 229 trillion cubic feet of natural gas and 75 billion barrels of condensate, according to Aramco’s corporate filings.
Jafurah’s first-phase capacity is 450 million cubic feet per day, with sales gas production expected to reach 200 million cubic feet per day initially, rising to 650 million by the end of 2026. The project’s ultimate target is 2 billion cubic feet per day by 2030 — a volume that would transform Saudi Arabia from a gas importer into a gas exporter. The total investment is projected at $100 billion across all phases, with Aramco having already awarded $25 billion in contracts for the Jafurah shale and Master Gas System expansion.
The timing is geopolitically exquisite. Saudi Arabia has spent decades burning crude oil and diesel to generate electricity — an economically irrational practice that consumed roughly 600,000 barrels of oil per day and deprived Aramco of export revenue. Mohammed bin Salman’s gas strategy aims to free those barrels for export by replacing oil-fired power generation with gas-fired plants, simultaneously reducing domestic emissions and increasing export revenue. Jafurah is the centrepiece of that strategy.
The current crisis validates the strategic logic of Jafurah in a way that no analyst forecast could. Saudi Arabia’s gas production is entirely domestic — it does not transit any chokepoint, is not subject to force majeure by a foreign government, and cannot be disrupted by Iranian mines or drones (assuming the production facilities themselves are defended). While Qatar’s gas sits trapped behind a minefield in the Strait of Hormuz, Saudi Arabia’s gas flows from wellhead to power plant entirely within the Kingdom’s borders.
The longer-term question is whether Saudi Arabia could eventually become an LNG exporter itself. The Kingdom’s current gas production is consumed domestically, and the Jafurah ramp-up is designed primarily to meet growing domestic demand from power generation, petrochemicals, and desalination. But if Jafurah’s production exceeds domestic requirements — a plausible scenario by the late 2020s — the case for building liquefaction capacity on the Red Sea coast, entirely bypassing the Strait of Hormuz, would be compelling. The Hormuz crisis has turned that theoretical proposition into a live strategic calculation in Riyadh.
What Does the LNG Crisis Mean for Global Electricity Prices?
Natural gas generates approximately twenty-three percent of the world’s electricity, according to the International Energy Agency. In countries that depend on LNG for a significant portion of their gas supply, the link between LNG prices and electricity prices is direct and immediate. A sixty-percent increase in LNG spot prices translates, with varying lags, into double-digit percentage increases in wholesale electricity costs.
Japan has already experienced wholesale electricity price spikes in the Kanto and Kansai regions, where gas-fired plants provide the marginal kilowatt-hour. South Korea’s Korea Electric Power Corporation (KEPCO) faces a choice between absorbing the increased fuel costs — deepening its already substantial operating losses — and passing them to consumers through tariff increases that would be politically toxic. European electricity markets, where gas-fired plants frequently set the marginal price, have seen wholesale prices rise by approximately thirty to forty percent since the crisis began.
The electricity price impact extends well beyond the power sector. Natural gas is the primary feedstock for ammonia production, which underpins the global fertiliser industry. Gulf fertiliser exports have already been disrupted by the Hormuz closure, and the LNG price spike is now threatening fertiliser production in countries that import gas for their own ammonia plants. India, the world’s second-most-populous country, depends on imported LNG for a growing share of its fertiliser production — a chain of dependency that connects a minefield in the Strait of Hormuz to crop yields in Uttar Pradesh.
The industrial consequences are particularly acute in Southeast Asia. The Philippines, Thailand, and Vietnam have growing LNG import requirements and limited alternative energy sources. Thailand generates roughly sixty-five percent of its electricity from natural gas, much of it imported. Vietnam was in the process of building its first LNG regasification terminal when the crisis hit. These economies face the prospect of energy rationing that could erase years of industrial development and poverty reduction.
Why the Gas Shortage Will Outlast the War
The conventional assumption, embedded in energy market forecasts and government contingency plans, is that the LNG crisis will resolve when the Hormuz crisis resolves. This assumption is wrong. Even if the Strait of Hormuz reopened tomorrow, the gas shortage would persist for months. The reasons are technical, logistical, and commercial.
LNG liquefaction plants cannot be restarted like a factory assembly line. The cryogenic systems — heat exchangers, compressors, refrigerant loops — require careful, sequential recommissioning after a full shutdown. QatarEnergy’s plants were designed for continuous operation and have never undergone a simultaneous cold restart across all liquefaction trains. Industry estimates suggest the full ramp-up from shutdown to nameplate capacity would take eight to sixteen weeks, depending on whether any equipment was damaged during the shutdown process.
The logistical challenge is equally formidable. When Hormuz reopens, there will be approximately 5,000 Iranian sea mines to clear before commercial shipping can transit safely. The U.S. Navy and allied minesweeping forces have the capability to clear the strait, but the process is painstakingly slow — historical precedent from the 1988 Tanker War suggests months of clearance operations. Insurance companies will not reinstate coverage until the waterway is certified safe by naval authorities, and underwriters take a conservative view of what constitutes “safe” in waters where mines have been recently deployed.
| Phase | Duration (Weeks) | Preconditions |
|---|---|---|
| Hormuz mine clearance | 12-24 | Ceasefire, naval operations begin |
| Insurance reinstatement | 4-8 | Mine clearance substantially complete |
| QatarEnergy plant restart | 8-16 | Equipment inspection, recommissioning |
| Full export volume recovery | 4-8 | Fleet repositioning, contract activation |
| Total estimated recovery | 28-56 | Approximately 7-14 months post-ceasefire |
The commercial dimension adds further delay. QatarEnergy’s force majeure declaration suspended its obligations under term contracts. Reactivating those contracts will require negotiations with buyers, many of whom will have secured alternative supply in the interim. Some buyers may seek to renegotiate terms, particularly if they believe the crisis has permanently altered the risk profile of Gulf-sourced LNG. The global LNG contract landscape — painstakingly built over decades of bilateral negotiations — may look very different on the other side of this conflict.
The most consequential long-term effect may be structural. The crisis has demonstrated that the LNG market’s concentration — three countries (the U.S., Australia, and Qatar) account for roughly sixty percent of global exports — creates systemic fragility. Removing one leg of that tripod paralyses the entire system. Governments and corporations will emerge from this experience with a fundamentally altered risk calculus, one that values supply diversity over cost efficiency. That recalculation will redirect tens of billions of dollars in energy investment over the coming decade, favouring domestic gas production, nuclear power, renewables, and pipeline connections — anything that does not require a ship to pass through a contested waterway.
For Saudi Arabia, the strategic implications extend beyond the immediate crisis. The Kingdom’s own gas development — anchored by Jafurah but extending across the Rub’ al Khali basin — positions it to supply domestic needs without any maritime vulnerability. If Riyadh eventually develops export capacity on the Red Sea coast, Saudi Arabia could emerge as the only major gas supplier in the Middle East whose exports do not depend on the Strait of Hormuz. That is a competitive advantage worth far more than the $100 billion investment in Jafurah — it is a structural hedge against the chokepoint vulnerability that is currently strangling Qatar’s economy. The March 18 strikes that caused extensive physical damage to Ras Laffan, Habshan, and Saudi refineries confirmed that the infrastructure destruction Iran has inflicted cannot be undone by a ceasefire alone.
The IEA’s record strategic petroleum reserve release addressed the oil dimension of the crisis. No equivalent mechanism exists for gas. There is no global strategic gas reserve, no coordinated release protocol, and no international body with the authority to allocate scarce LNG cargoes among competing national claimants. The crisis has exposed this institutional gap with uncomfortable clarity. When the war ends, the debate over how to fill it will reshape energy governance for a generation.
Yet the Hormuz chokepoint extends well beyond hydrocarbons. The same blockade strangling gas exports is simultaneously severing copper and aluminum supply chains that underpin global manufacturing, a metals dimension of the crisis that energy-focused headlines have largely obscured.
Frequently Asked Questions
How much of the world’s LNG supply has been disrupted by the Hormuz crisis?
Approximately twenty percent of global LNG trade passes through the Strait of Hormuz, nearly all originating from Qatar. QatarEnergy’s shutdown of its Ras Laffan and Mesaieed facilities has removed an estimated 5.8 million tonnes of LNG from the monthly global supply, representing a fourteen percent reduction in the worldwide monthly forecast, according to Kpler data from March 2026.
Why can LNG not be rerouted through pipelines like crude oil?
Liquefied natural gas must be cooled to minus 162 degrees Celsius and transported in specialised cryogenic tanker vessels. Unlike crude oil, which can flow through conventional pipelines at ambient temperature, LNG requires purpose-built liquefaction plants at the point of export and regasification terminals at the point of import. Qatar has no pipeline connection to markets outside the Gulf region, making seaborne transport through the Strait of Hormuz the only viable export route.
How long will it take for Qatar’s LNG exports to recover after the war ends?
Industry analysts estimate a total recovery timeline of seven to fourteen months after a ceasefire. This includes twelve to twenty-four weeks for mine clearance in the Strait of Hormuz, four to eight weeks for insurance reinstatement, eight to sixteen weeks for QatarEnergy’s plant restart, and an additional four to eight weeks for fleet repositioning and contract reactivation, according to assessments from Kpler and industry engineering consultants.
Which countries are most vulnerable to the LNG supply disruption?
Pakistan and Bangladesh face the most extreme vulnerability, with Gulf LNG accounting for thirty-five to fifty percent of their gas supply and reserves covering less than ten days. Japan and South Korea face critical exposure, holding two to four weeks and nine to fifty-two days of LNG reserves respectively. European nations such as Belgium, Italy, and Poland are moderately exposed, while Germany and France benefit from Norwegian pipeline gas and higher storage levels.
Can the United States replace Qatar’s LNG production?
Not in the short term. American LNG export plants operated at ninety-two to ninety-five percent utilisation in early 2026, leaving limited spare capacity. New facilities at Plaquemines and Golden Pass are adding approximately 4 billion cubic feet per day, but this additional volume falls well short of the 5.8-million-tonne monthly shortfall from Qatar. Transit times from the U.S. Gulf Coast to Asian markets are also roughly double those from Qatar, effectively halving fleet carrying capacity.
What is Saudi Arabia’s Jafurah gas field and how does it relate to this crisis?
Jafurah is the largest unconventional gas development outside the United States, holding an estimated 229 trillion cubic feet of reserves in Saudi Arabia’s Eastern Province. Aramco began production in December 2025 and is targeting 2 billion cubic feet per day by 2030, with a total investment of $100 billion. The project’s domestic focus — gas flows entirely within Saudi borders without transiting any chokepoint — positions it as strategically immune to the type of disruption currently paralysing Qatar’s exports.