
RIYADH — Twenty-six days into the most destructive conflict the Middle East has witnessed since the Iran-Iraq War, the economic toll has surpassed every credible projection issued before the first cruise missile left its launcher. A collective bill approaching two trillion dollars — spanning military expenditure, infrastructure obliteration, energy market disruption, and cascading trade losses — now sits across the desks of finance ministries from Washington to Riyadh to Tehran, with no ceasefire in sight to stop the meter running. The war that began on February 28, 2026, with coordinated American and Israeli strikes on Iranian nuclear and military facilities, has evolved into something its architects never budgeted for: a conflict where the economic damage compounds daily at a rate that dwarfs the strategic objectives either side can plausibly achieve.
Table of Contents
- How Much Has the Iran War Cost the United States?
- What Is Saudi Arabia’s War Bill?
- The Interceptor Paradox — When Defense Costs More Than Offense
- How Much Has Iran Lost in 26 Days?
- Who Is Actually Making Money From This War?
- The Energy Market Disruption Balance Sheet
- The War Cost Accountability Matrix
- Can the Global Economy Absorb a Three-Trillion-Dollar Shock?
- What Are the Hidden Costs No Government Will Acknowledge?
- The Contrarian Case — War Is Making Saudi Arabia Richer
- What Happens to the Bill When the Shooting Stops?
- Frequently Asked Questions
How Much Has the Iran War Cost the United States?
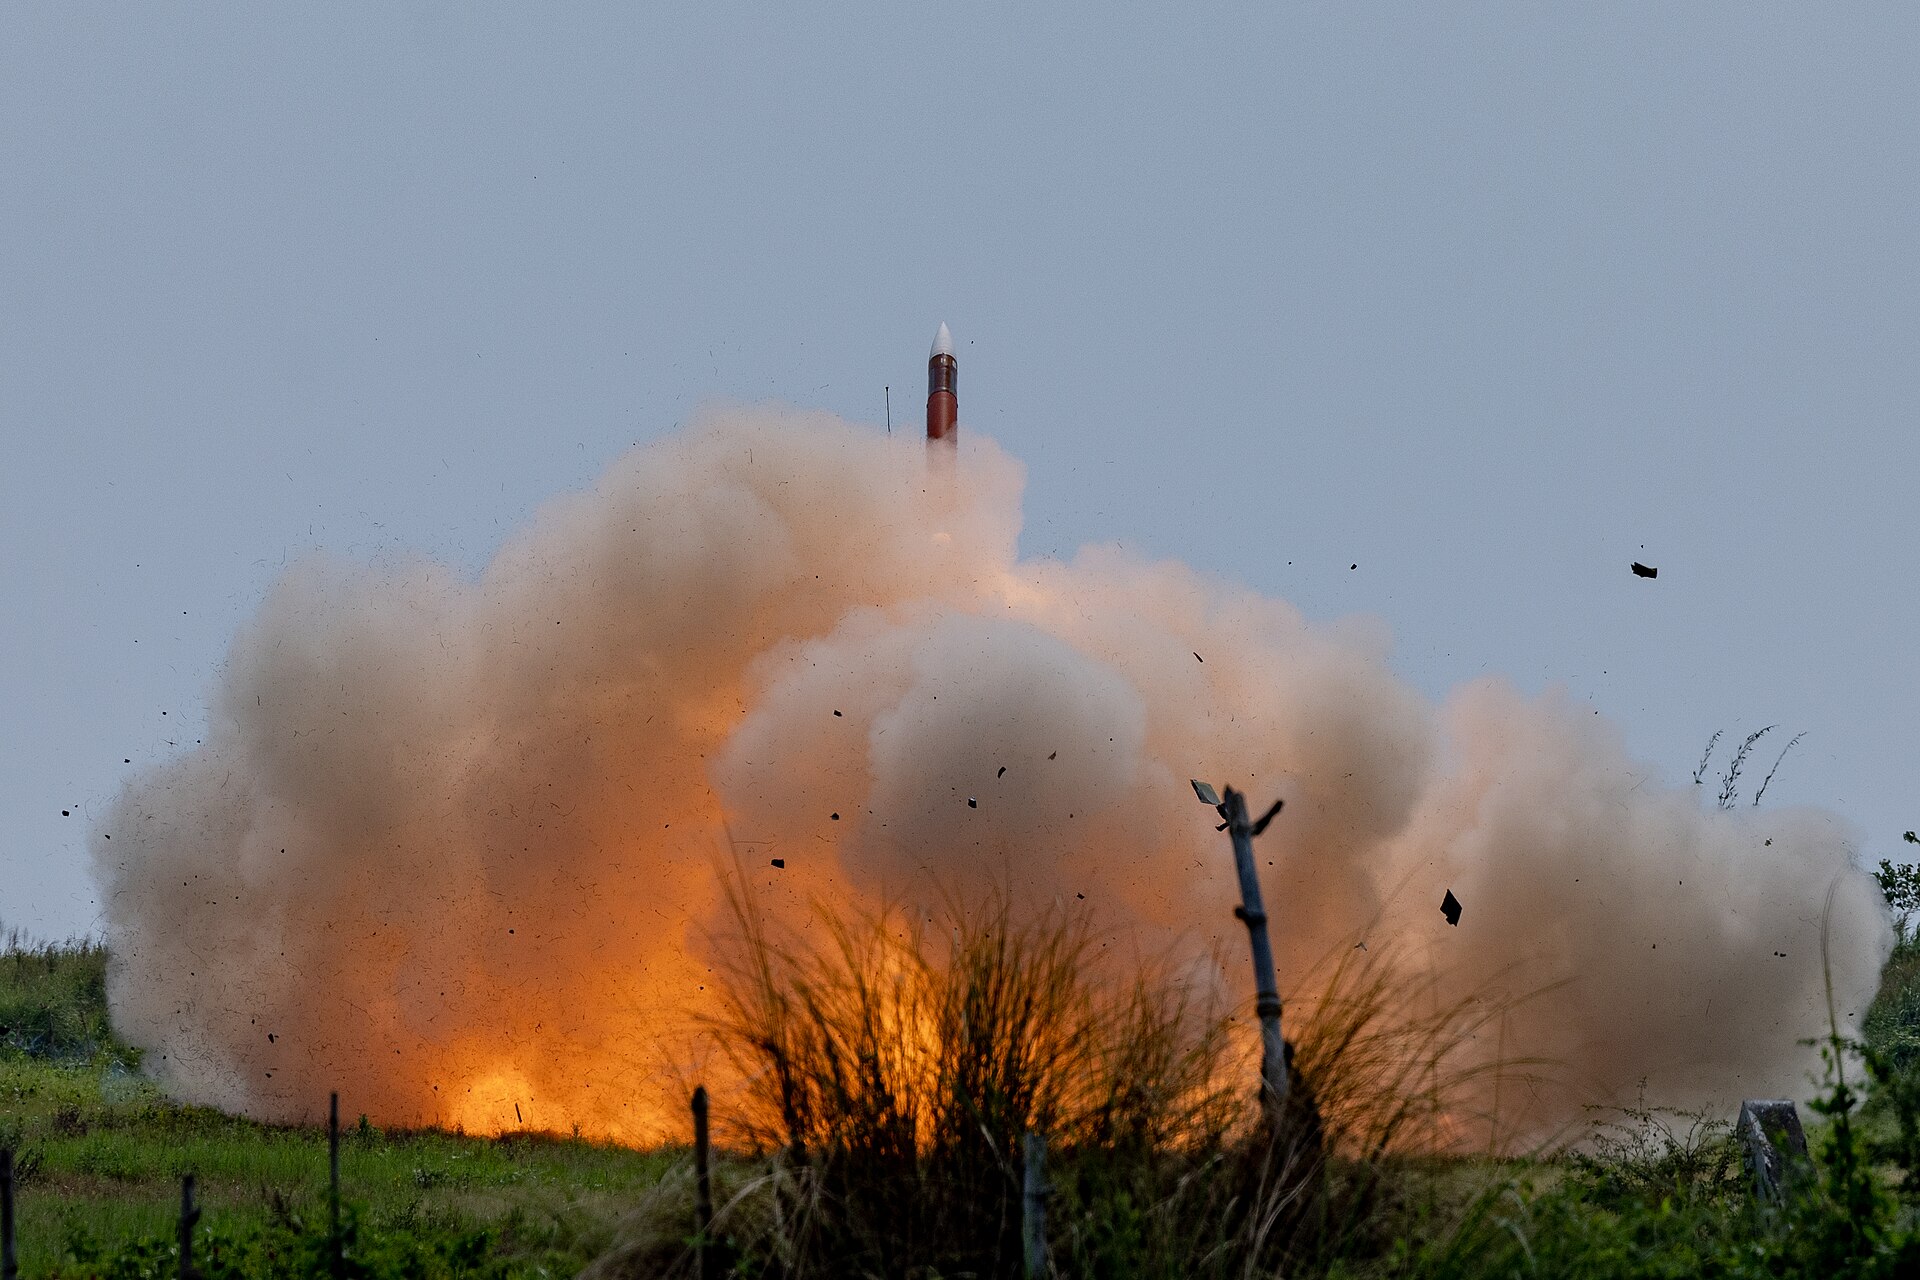
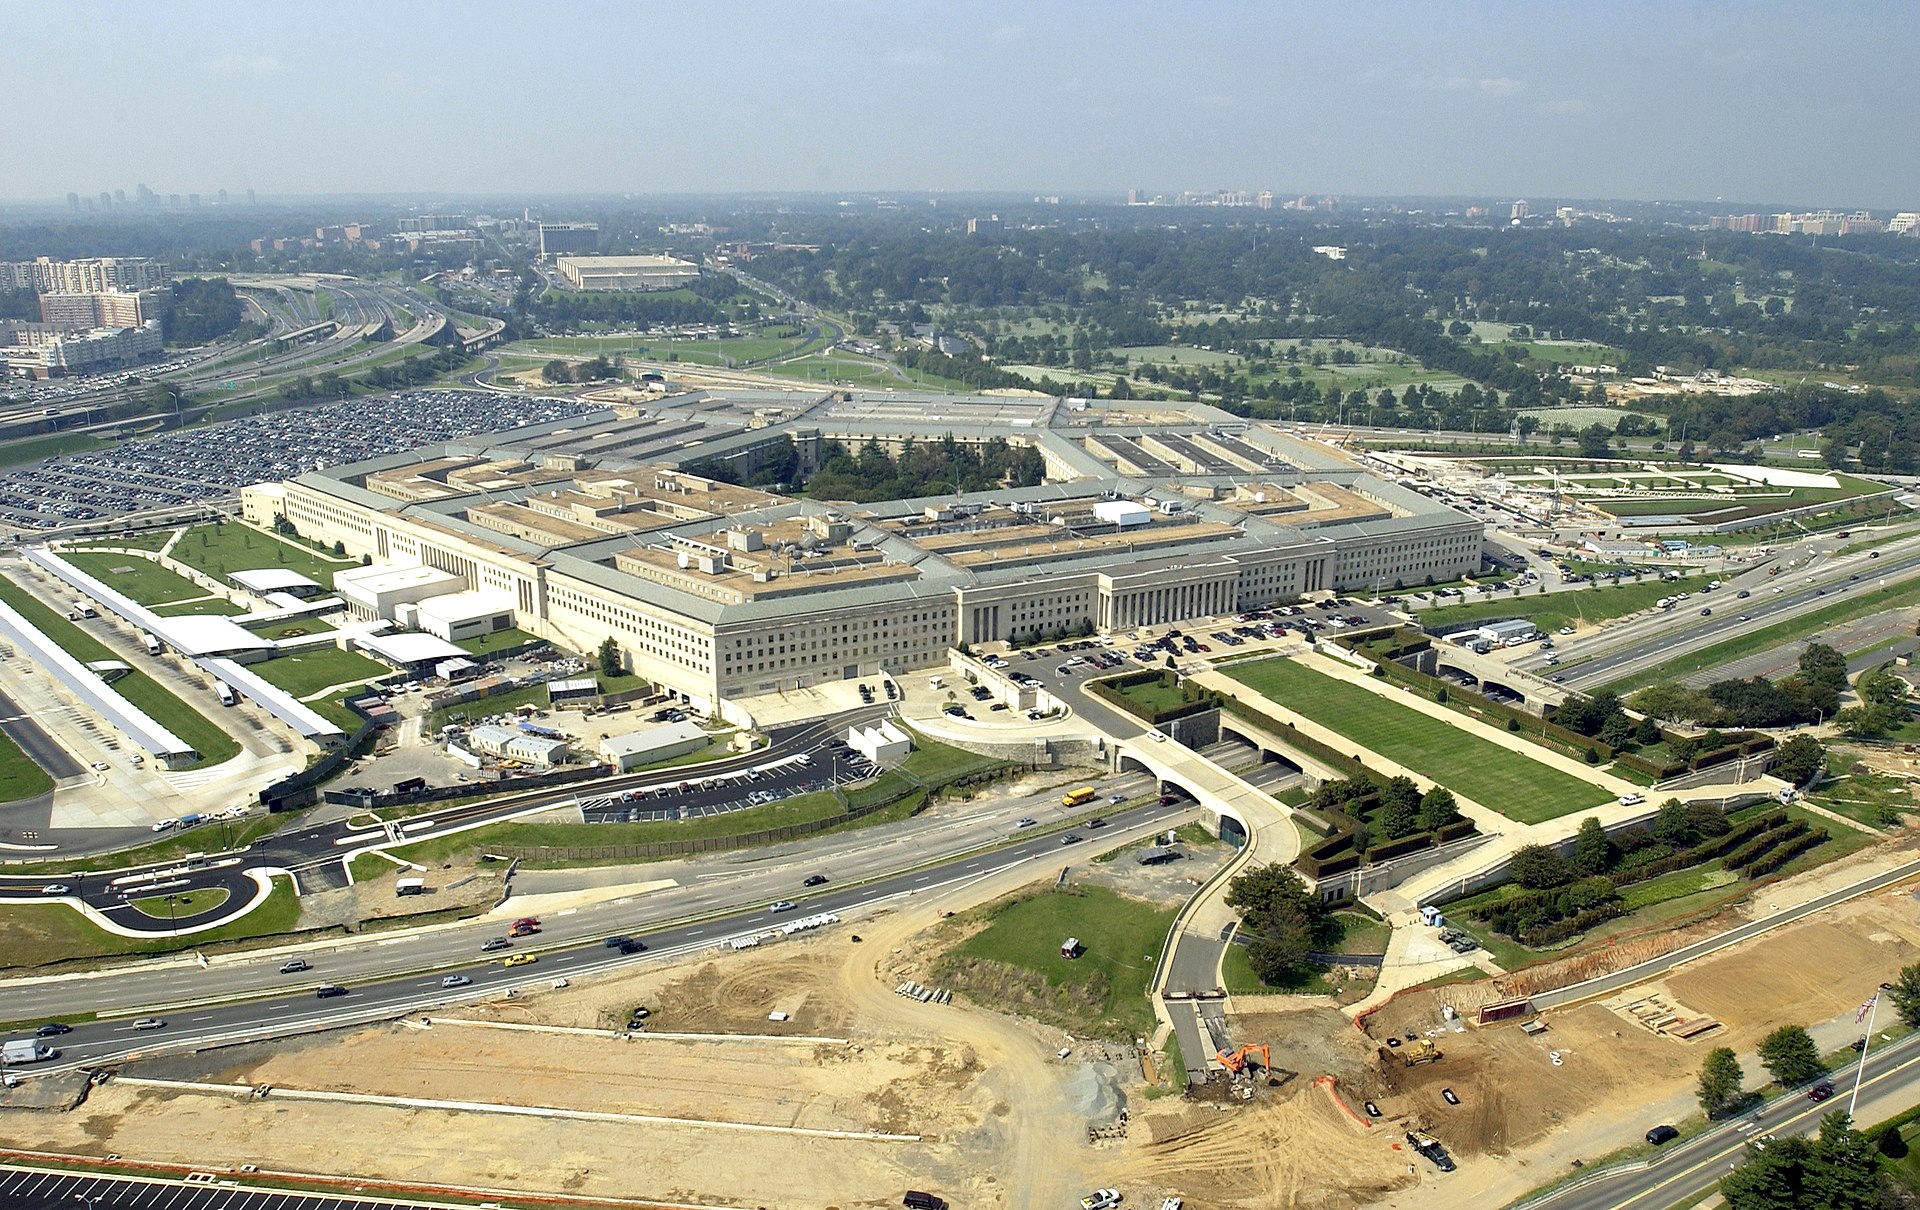
The Pentagon disclosed to Congress that the first six days of combat operations against Iran consumed $11.3 billion in direct military expenditure, according to NBC News reporting on classified briefings delivered to the Senate Armed Services Committee. That figure, averaging nearly $1.9 billion per day in the opening phase, encompasses munitions expenditure — including 4,600 precision-guided bombs, 340 Tomahawk cruise missiles, and 46 GBU-57 Massive Ordnance Penetrators used against Iran’s hardened nuclear facilities — as well as operational costs for the five carrier strike groups deployed to the region.
Kevin Hassett, director of the White House National Economic Council, acknowledged on March 6 that cumulative costs had already reached $12 billion. By March 25, conservative estimates place total American military spending between $25 billion and $40 billion, depending on whether replacement munitions costs and accelerated equipment depreciation are included in the calculation. The Institute for Policy Studies in Washington pegs the daily operational cost at $891.4 million, while The National reported that broader estimates including logistical surge capacity and medical costs push the figure closer to $2 billion per day.
Defense Secretary Pete Hegseth has requested an additional $200 billion in supplemental funding from Congress to sustain operations and replenish depleted munitions stockpiles. Fortune Magazine calculated that at current consumption rates, that sum would fund approximately 100 to 200 additional days of combat — a tacit acknowledgment that the Pentagon is planning for a conflict measured in months, not weeks. The 82nd Airborne Division deployment announced on March 24, sending two thousand paratroopers to the Gulf, signals the kind of ground force posture that historically transforms supplemental spending requests into permanent budget expansions.
The munitions consumption rate tells its own story. The United States has expended more than 4,600 precision-guided bombs and 340 Tomahawk cruise missiles in 26 days — a depletion rate that exceeds the entire stockpile used during the 2003 Iraq invasion’s first month. Each Tomahawk costs approximately $2.1 million. Each GBU-57 Massive Ordnance Penetrator, used against Iran’s fortified nuclear facilities, costs $3.5 million per unit. The Joint Air-to-Surface Standoff Missile Extended Range (JASSM-ER), which has become a workhorse of the air campaign, runs $1.4 million per round. Munitions replacement alone may account for $8 billion to $12 billion of the total war cost.
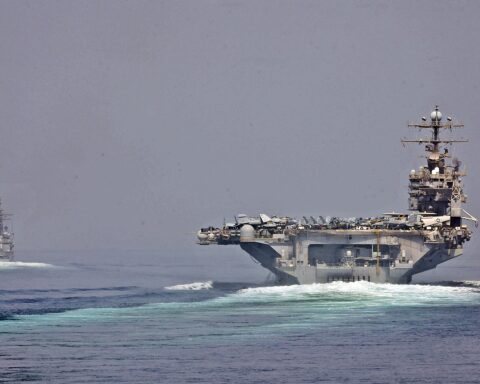
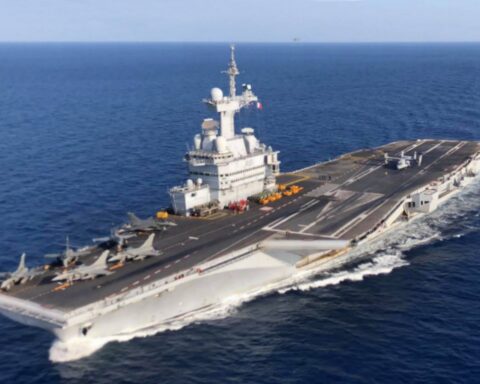
The comparison with recent American wars is instructive. The 2003 invasion of Iraq cost approximately $1.7 billion per day in inflation-adjusted terms during the initial combat phase. The 2011 Libya intervention ran approximately $60 million daily. The Iran war sits somewhere between these poles — more expensive than any limited operation in American history, but cheaper per day than a full ground invasion, largely because Washington has so far avoided committing armoured divisions to Iranian soil. The five carrier strike groups deployed to the region each cost approximately $6.5 million per day to operate, adding roughly $32.5 million daily in naval operational costs before a single weapon is fired.
What Is Saudi Arabia’s War Bill?
Saudi Arabia’s war expenditure defies simple accounting because the Kingdom occupies a singular position in this conflict: it is simultaneously a target of Iranian attacks, a logistics platform for American operations, and a beneficiary of the oil price surge the war has generated. The direct costs, the indirect costs, and the offsetting revenues create a balance sheet that no other belligerent or quasi-belligerent can replicate.
On the direct cost side, Wood Mackenzie, the Edinburgh-based energy consultancy, estimated that Saudi Arabia lost approximately $4.5 billion in oil revenue during the first three weeks of the war. Aramco’s crude exports through the Strait of Hormuz — which prior to the conflict carried roughly 6.2 million barrels per day of Saudi production — dropped to effectively zero after Iran’s March 4 blockade. The 1,200-kilometre East-West pipeline to Yanbu on the Red Sea has partially compensated, but its 5 million barrel per day capacity cannot match pre-war export volumes, and the Houthi threat to Yanbu-bound tankers adds further uncertainty.
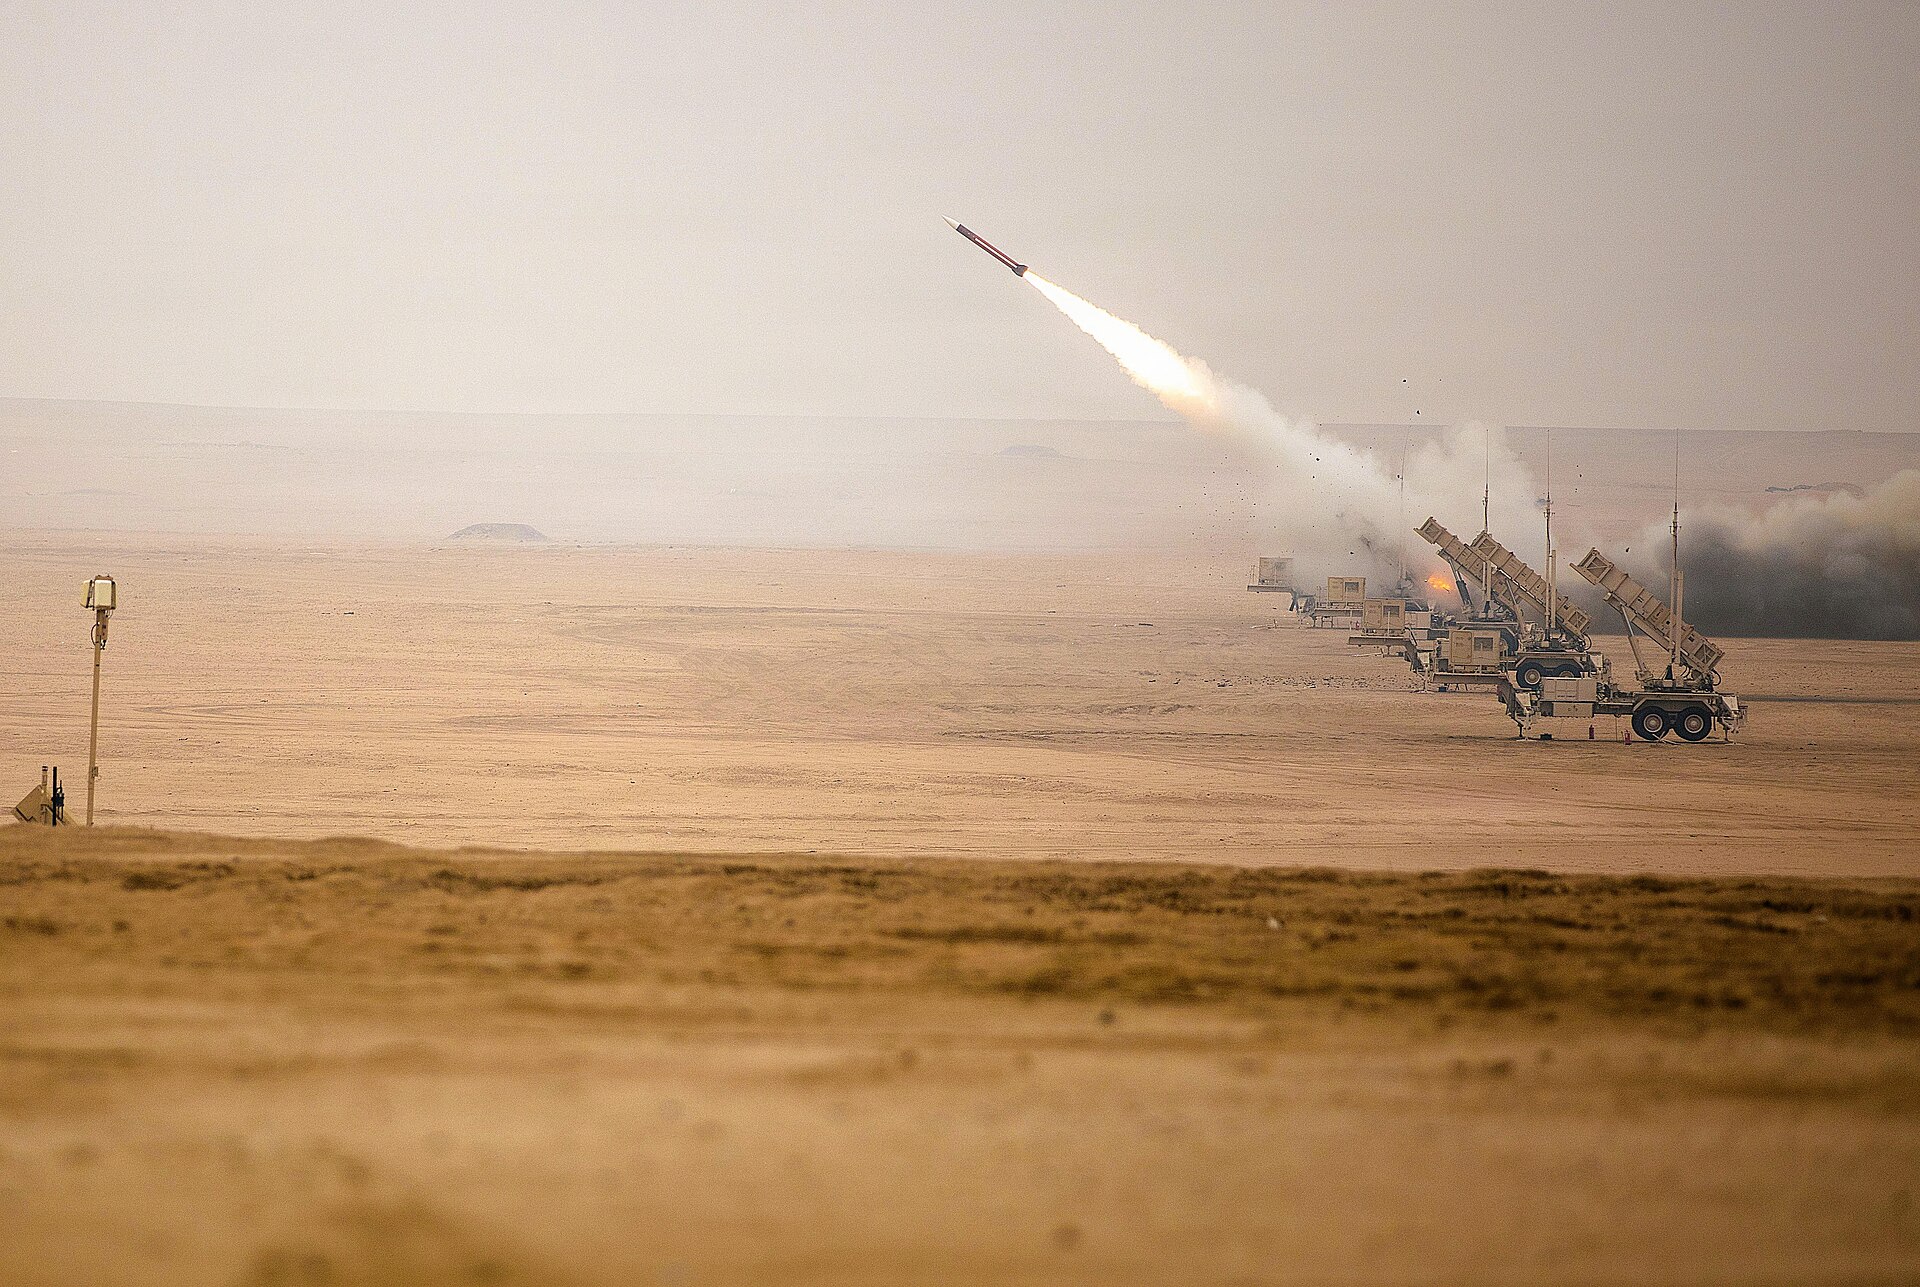
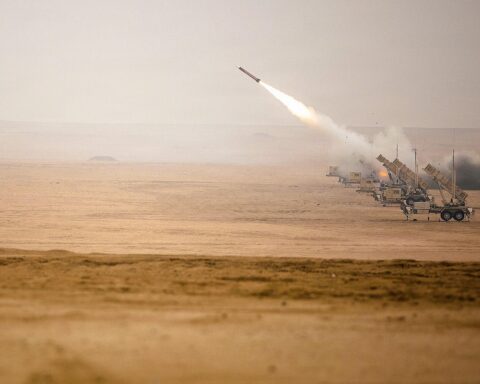
Saudi Arabia’s air defense costs represent the most visible line item. The Kingdom’s Ministry of Defense reported intercepting and destroying more than 575 drones and 49 ballistic missiles as of March 24. Each Patriot Advanced Capability-3 (PAC-3) interceptor costs between $2 million and $4 million per missile. Each Terminal High Altitude Area Defense (THAAD) interceptor runs approximately $12.77 million, according to a January 2026 Lockheed Martin contract. The arithmetic suggests Saudi Arabia has consumed between $1.5 billion and $3 billion in interceptor costs alone — to defend against Iranian drones that cost between $20,000 and $50,000 each. A comprehensive analysis of the gap between Saudi Arabia’s defense spending and its operational capability reveals why the world’s seventh-largest military budget proved insufficient.
Goldman Sachs forecast that if the conflict continues through the end of April, Saudi Arabia’s GDP could contract by approximately 3 percent in 2026, a striking reversal for a Kingdom that posted 4.1 percent growth in the fourth quarter of 2025. The Public Investment Fund has already redirected capital from megaprojects like NEOM toward food security and strategic reserves, an allocation shift that represents billions in deferred economic development even if it never appears as a war cost in traditional accounting.
The Interceptor Paradox — When Defense Costs More Than Offense
The defining economic absurdity of the Iran war is the cost ratio between attack and defense. Iran’s Shahed-136 one-way attack drones cost between $20,000 and $50,000 to produce. The interceptors required to shoot them down cost between $1 million and $4 million per engagement. At its most extreme, this represents a 200-to-1 cost disadvantage for the defender — a ratio that no military budget, however vast, can sustain indefinitely.
Saudi Arabia has intercepted more than 600 aerial threats in 26 days. If the average engagement cost is $2.5 million — a conservative midpoint that blends cheaper point-defense systems with premium PAC-3 and THAAD intercepts — the Kingdom has spent approximately $1.5 billion purely on the kinetic act of destroying incoming projectiles. Iran’s corresponding expenditure on the drones and missiles it launched is estimated at $300 million to $500 million, according to the missile tracking website MissileStrikes.com.
The strategic implications extend beyond the immediate theatre. Every PAC-3 interceptor fired over Riyadh is one fewer available for Taipei, as this publication has previously reported. Lockheed Martin signed a contract in January 2026 to quadruple THAAD interceptor production from 96 to 400 units per year, but even at the accelerated rate, current consumption in the Gulf will deplete stockpiles faster than they can be replenished.
| Metric | Iran (Attacker) | Saudi Arabia / Coalition (Defender) |
|---|---|---|
| Drones launched | 2,000+ | — |
| Ballistic missiles launched | 49+ | — |
| Successful intercepts | — | 575+ |
| Cost per drone/missile | $20,000–$50,000 | — |
| Cost per interceptor | — | $1M–$12.77M |
| Estimated total cost | $300M–$500M | $1.5B–$3B |
| Cost ratio (attack:defense) | 1:5 to 1:200 | |
The War on the Rocks analysis published on March 18 cautioned against reading too much into raw launch numbers, noting that Iran’s drone production is decentralized across an estimated 30 facilities, many of them hardened or underground. Despite coalition airstrikes targeting these sites, Iran was still producing approximately 6.7 drones per day as of mid-March. If that rate continues, Iran can sustain its aerial campaign longer than Saudi Arabia and the United States can afford to intercept it at current cost ratios.
How Much Has Iran Lost in 26 Days?
Iran’s losses are catastrophic by any measure, but the precise figure depends on which accounting framework applies. The International Business Times reported that analysts estimate direct physical damage and immediate economic losses at “tens of billions of dollars,” a range that reflects both the difficulty of assessing damage in an active war zone and the genuine uncertainty about which facilities can be repaired versus which must be rebuilt from scratch.
The physical toll is staggering. By March 24, twenty-five days of sustained American and Israeli airstrikes had damaged or destroyed more than 82,000 structures across Iran, according to satellite imagery analysis. Dozens of refineries, oil fields, gas processing plants, ports, and power generation facilities have sustained damage sufficient to take them offline. Bloomberg published a comprehensive list of damaged energy infrastructure on March 19 that ran to several pages.
Iran’s GDP, which stood at approximately $400 billion before the war, is projected to contract by more than 10 percent in 2026, according to Oxford Economics. The country’s oil exports — which provided roughly 40 percent of government revenue — have been severely disrupted. The Kpler commodities intelligence firm estimated that Iranian crude exports fell from 1.38 million barrels per day in February to near zero in the first week of March, though some volumes have resumed through overland routes to Turkey and ship-to-ship transfers outside the Gulf.
The human cost compounds the economic damage. More than 1,072 people have been killed in Lebanon alone since the offensive escalated on March 2, according to the Lebanese Ministry of Public Health. Iranian civilian casualties, while more difficult to verify, include twelve people killed in a single raid on southern Tehran on March 25. The reconstruction cost for Iran’s civilian infrastructure — residential buildings, hospitals, schools, and UNESCO heritage sites including the Golestan Palace — will run into additional tens of billions, with no obvious source of financing given the country’s isolation from international capital markets.
Who Is Actually Making Money From This War?
Every war produces winners. The Iran conflict has generated extraordinary returns for three distinct categories of beneficiary: defense contractors, alternative energy suppliers, and financial safe havens. The scale of their gains offers a useful lens for understanding how the war’s costs are being redistributed rather than simply destroyed.
American defense stocks have experienced their strongest sustained rally since the early phase of the Ukraine war. RTX Corporation, the parent company of Raytheon, has gained 110 percent since March 2023, with the Iran conflict adding the latest surge. Northrop Grumman is up 60 percent, General Dynamics 57 percent, and Lockheed Martin 37 percent. The Patriot missile system, THAAD interceptors, and precision-guided munitions that define daily operations in the Gulf are all produced by these firms, and order books have never been fuller.
Russia has emerged as the war’s most consequential indirect beneficiary. The Carnegie Endowment for International Peace documented how Trump’s war is boosting Russian oil exports, with Russia shipping approximately 300,000 barrels per day more crude to China in January and February 2026 than in the same period a year earlier. The ESPO pipeline — which delivers Russian crude from East Siberia directly to China, bypassing Hormuz entirely — has become the world’s most strategically valuable oil artery. Moscow collected the windfall from higher global oil prices while simultaneously positioning itself as Beijing’s most reliable energy partner.
Gold reached $5,594 per ounce on January 29, 2026, setting an all-time record before the war even began. The conflict pushed prices past $5,300 in the first week of March. J.P. Morgan now projects gold will reach $6,300 per ounce by year’s end, while Deutsche Bank targets $6,000. Central banks have accelerated purchases, with the World Gold Council forecasting roughly 850 tonnes of government gold buying in 2026. The Saudi Arabian Monetary Authority (SAMA) holds substantial gold reserves, meaning the Kingdom is paradoxically profiting from the safe-haven trade even as the war that drives it threatens its infrastructure.
The Energy Market Disruption Balance Sheet
The energy market disruption generated by the Iran war represents the single largest economic impact of the conflict, dwarfing direct military expenditure by an order of magnitude. When Iran’s IRGC effectively closed the Strait of Hormuz on March 4, it severed the world’s most important oil chokepoint — a waterway that prior to the conflict carried approximately 21 million barrels per day, representing roughly 20 percent of global oil consumption.
Brent crude surged from approximately $76 per barrel in late February to a peak of $126 per barrel in mid-March, before retreating to approximately $101 as of March 24. The OPEC reference basket averaged $114.40 per barrel in March compared to $67.90 in February — a 68 percent increase in a single month. The International Energy Agency’s March Oil Market Report characterized the disruption as the “greatest global energy and food security challenge in history,” surpassing the 1973 Arab oil embargo, the 1979 Iranian Revolution, and the 1990 Iraqi invasion of Kuwait.
Collective oil production losses across the Gulf are enormous. Iraq, OPEC’s second-largest producer, saw output from its three main southern oilfields collapse by 70 percent to 1.3 million barrels per day. Kuwait, the fifth-largest OPEC producer, announced precautionary cuts. Iranian output fell to near zero. Combined with Saudi Arabia’s Hormuz-dependent exports, an estimated 10 million barrels per day of global supply has been disrupted — a shortfall that exceeds OPEC’s total spare capacity, which sits largely on paper in Saudi Arabia and the UAE at between 3 and 4 million barrels per day.
Shipping insurance costs have become a secondary economic weapon. War-risk premiums for Hormuz transit surged more than 300 percent compared to January 2025 levels, according to Euronews. Insuring an oil tanker worth $100 million now costs approximately $5 million per transit — a fivefold increase from the early days of the conflict and roughly sixty times pre-crisis rates according to some major marine insurers. Daily charter rates for oil supertankers quadrupled to nearly $800,000, while the cost of hauling crude from the Middle East to China hit a record $423,736 per day. Insurers effectively closed Hormuz before Iran’s navy could, as commercial risk logic accomplished what naval mines and anti-ship missiles reinforced.

The War Cost Accountability Matrix
Aggregating costs across multiple theatres, currencies, and time horizons requires a structured framework. The matrix below captures the known and estimated costs as of Day 26, organized by the party bearing the expense and the category of loss. Figures represent best available estimates from named sources and should be treated as indicative ranges rather than precise accountings.
| Party | Military Costs | Infrastructure Losses | Revenue Losses | GDP Impact | Estimated Total |
|---|---|---|---|---|---|
| United States | $25B–$40B | Minimal (base damage) | N/A | –0.3% to –0.5% | $25B–$40B |
| Iran | $5B–$10B | $30B–$60B | $8B–$15B (oil) | –10%+ | $50B–$85B |
| Saudi Arabia | $1.5B–$3B (intercepts) | $500M–$1B | $4.5B (oil) | –3% | $6.5B–$8.5B |
| Kuwait | $500M–$1B | $2B–$4B | $3B–$5B (oil) | –14% | $5.5B–$10B |
| Iraq | $1B–$2B | $5B–$10B | $10B–$15B (oil) | –8% to –12% | $16B–$27B |
| Global economy | — | — | — | –0.54% to –3.15% | $590B–$3.5T |
The matrix reveals a structural pattern: the parties suffering the greatest proportional damage — Iran, Kuwait, Iraq — are not the parties making the strategic decisions that started or sustain the conflict. Saudi Arabia sits in an unusual middle category, absorbing significant costs while simultaneously benefiting from oil price dynamics that partially offset its losses. The United States bears the largest absolute military expenditure but the smallest proportional economic impact, its continental economy insulated by domestic energy production and geographic distance.
The framework is designed to be updated as the war evolves. Each additional week of conflict adds approximately $7 billion to $14 billion in direct US military costs, an indeterminate but growing sum in Iranian infrastructure destruction, and a global GDP penalty that compounds nonlinearly as supply chain disruptions cascade through second- and third-order effects.
Can the Global Economy Absorb a Three-Trillion-Dollar Shock?
The Chatham House analysis published in mid-March projected global GDP losses ranging from $590 billion if the conflict ends quickly to more than $3.5 trillion — equivalent to 3.15 percent of global output — if the war continues through the summer. The World Trade Organization warned that sustained high energy prices could reduce forecasted 2026 global GDP growth by 0.3 percentage points. Oxford Economics characterized the scenario as the most severe global supply disruption since the 1970s oil shocks, with the critical distinction that today’s global economy is far more interconnected and therefore more vulnerable to cascading disruptions.
Europe, heavily dependent on imported energy, faces the steepest proportional hit. Growth could fall at least one percentage point below pre-war forecasts, according to Goldman Sachs, effectively pushing several eurozone economies into recession. The poorest countries on earth are paying a disproportionate share of the war’s cost, as this publication has documented — nations across sub-Saharan Africa and South Asia lack the strategic petroleum reserves, alternative supply contracts, and fiscal buffers that allow wealthier countries to absorb energy price shocks.
China presents the most complex case study. Over 55 percent of Chinese oil imports originate in the Middle East, with Saudi Arabia, Iran, Iraq, the UAE, Oman, Kuwait, and Qatar collectively providing 56.2 percent of China’s crude supply according to Columbia University’s Center on Global Energy Policy. Beijing ordered its largest refineries to halt diesel and petrol exports on March 5, an emergency measure to preserve domestic fuel supplies. China’s 1.39 billion barrels of oil in storage provide a 120-day cushion, but that buffer is depleting. Russia’s ESPO pipeline and increased seaborne shipments have partially compensated, but replacement barrels arrive at premium prices and lower quality than the medium-sour grades Chinese refineries are optimised to process.
The Indian oil crisis is more acute. With strategic reserves sufficient for approximately nine days of consumption and a heavy dependence on Gulf suppliers, India faces the most immediate and severe energy emergency of any major economy. The Indian Navy has deployed warships to escort tankers, a stopgap measure that underscores how the war’s economic costs are being borne by countries that had no role in starting it.
What Are the Hidden Costs No Government Will Acknowledge?
The numbers in every official estimate share a common deficiency: they exclude the costs that no government has an incentive to count. These hidden costs may ultimately dwarf the visible ones, but they will never appear in a Pentagon briefing or a Saudi Ministry of Finance statement because they are politically inconvenient, methodologically difficult, and distributed across populations that lack the power to demand an accounting.
Environmental damage represents the most consequential omission. The slow poisoning of the Persian Gulf — from oil spills, burning refineries, depleted uranium contamination, and chemical residue from intercepted munitions — will impose health and ecological costs measured in decades rather than dollars. The Gulf’s shallow, warm waters are particularly vulnerable to hydrocarbon contamination. The desalination plants that provide 70 percent of Saudi Arabia’s drinking water draw from these same waters. Any long-term contamination of the Gulf’s marine environment would require the most expensive remediation effort in environmental history.
Human capital destruction is equally invisible in the economic data. Iran has lost an unknown number of engineers, scientists, and technicians in strikes on military and industrial facilities. The exodus of educated Iranians that was already underway before the war has accelerated. Saudi Arabia faces its own human capital challenge: the thirty-five million migrant workers across the Gulf who build, clean, and operate the physical infrastructure of the region’s economies are trapped in a conflict zone with no evacuation plan. Their departure — whether through fear, visa expiration, or employer insolvency — would cripple construction, hospitality, and logistics sectors that cannot function without imported labour.
Opportunity cost may be the largest hidden expense of all. Every dollar the United States spends on Tomahawk missiles is a dollar not invested in infrastructure, education, or debt reduction. Every riyal Saudi Arabia spends on Patriot interceptors is a riyal not building the post-oil economy that Vision 2030 was designed to create. Every rial Iran spends on Shahed drones is a rial not invested in the civilian economy that its population desperately needs. The aggregate opportunity cost of the Iran war — capital allocated to destruction rather than creation — may approach the direct expenditure figures, effectively doubling the war’s true price without appearing on any balance sheet.
Tourism and foreign direct investment losses compound over time in ways that defy point-in-time measurement. Saudi Arabia had attracted $26 billion in FDI commitments in 2025 across entertainment, tourism, sports, and technology sectors. The World Economic Forum postponed its Jeddah conference. International hotel chains, airlines, and event organisers are reassessing Gulf exposure. Each postponement and cancellation carries not just the immediate revenue loss but a reputational discount that will persist in investment committee risk models for years after the last drone is intercepted.
The Contrarian Case — War Is Making Saudi Arabia Richer
The conventional narrative frames Saudi Arabia as a victim of the Iran war — a country absorbing drone attacks, losing oil revenue, and watching its Vision 2030 megaprojects stall. The data tells a more complicated story. By several measures, the war is generating net economic benefits for the Kingdom that its pre-war trajectory could not have delivered.
The oil price surge is the most obvious mechanism. At $110 per barrel — roughly the March average — Saudi Arabia generates approximately $119 million per day in additional revenue above pre-war baseline prices, according to analysis from Chatham House. Over 26 days, that windfall amounts to roughly $3.1 billion, partially offsetting the $4.5 billion in lost exports through Hormuz. If East-West pipeline throughput continues to increase and the Red Sea route remains viable, Saudi Arabia’s net oil revenue position may approach breakeven or even turn positive within weeks.
At $110 per barrel, Saudi Arabia is running a budget surplus of approximately 8 to 10 percent of GDP, according to data compiled from the Kingdom’s 2026 budget statement. The pre-war 2025 fiscal deficit of 5.3 percent of GDP has evaporated. The Kingdom’s $156 billion in external debt suddenly looks more manageable when denominated against surging revenues and a current account that has swung dramatically into surplus.
Crown Prince Mohammed bin Salman’s geopolitical leverage has expanded correspondingly. As the custodian of the world’s last significant spare oil capacity — estimated at 2 million barrels per day — and the operator of the only major pipeline bypassing Hormuz, MBS holds cards that make him indispensable to Washington, Beijing, New Delhi, and Tokyo simultaneously. That leverage has reversed fifty years of Saudi dependence on American security guarantees, transforming the relationship from patron-client to something closer to equals negotiating terms.
“The war has achieved in 26 days what Saudi Arabia could not accomplish in 26 years of diplomatic effort: it has made the Kingdom irreplaceable.”Analysis based on Chatham House assessment, March 2026
The contrarian case has limits. Saudi Arabia’s long-term economic diversification depends on foreign investment, tourism, entertainment, and technology partnerships that all require security and stability. The World Economic Forum postponed its Jeddah conference. Formula One and sporting events face uncertain futures. The PIF’s pivot from NEOM to grain signals that wartime priorities are displacing developmental ones. The war may be making Saudi Arabia richer in the short term, but it is making Vision 2030 poorer in the long term. Whether the revenue windfall can be reinvested productively after the conflict ends will determine whether the war’s net economic impact on the Kingdom is positive or devastating.
What Happens to the Bill When the Shooting Stops?
Reconstruction costs represent the largest and least discussed component of the war’s total price. The physical destruction of Iran’s energy infrastructure alone will require years and potentially hundreds of billions of dollars to repair. Refineries, LNG terminals, and power plants that process hundreds of thousands to millions of barrels per day cannot be rebuilt in months — the engineering timelines for such facilities typically run to three to five years under optimal conditions, which post-war Iran will not enjoy.
The question of who pays is politically intractable. American war reparations to adversaries have no precedent in modern history. Iran’s limited access to international capital markets — a legacy of decades of sanctions — means reconstruction financing will depend on Chinese, Russian, and possibly Indian investment. The scale required dwarfs anything these partners have historically provided. Saudi Arabia has already begun preparing a legal case for reparations over damage to its own infrastructure, a process that will take years to adjudicate through international courts.
The energy market will not return to its pre-war state even after a ceasefire. The war premium embedded in oil prices and shipping insurance reflects structural risk reassessment, not temporary panic. Tanker operators, insurers, and commodity traders have learned that Hormuz is a chokepoint that can be closed. That lesson will persist in risk models for decades, adding a permanent cost premium to Gulf energy exports that Saudi Arabia and its neighbours will bear regardless of the conflict’s outcome.
Global military spending will increase across nearly every country that participates in or observes this war. Japan and South Korea are already expanding defense budgets. European NATO members are accelerating procurement timelines. India and Pakistan have deployed warships. The world’s annual military expenditure, which SIPRI estimated at $2.44 trillion in 2023, will almost certainly exceed $3 trillion in 2027 — a rearmament cycle triggered by a war whose original objectives could have been achieved, if at all, through far less expensive means.
| Indicator | Pre-War (Feb 2026) | Wartime (Mar 25, 2026) | Change |
|---|---|---|---|
| Oil price (Brent, $/bbl) | $76 | $101–$114 | +33% to +50% |
| Fiscal balance (% GDP) | –5.3% | +8% to +10% | Surplus swing |
| Oil export volume (mbpd) | ~7.5 | ~4.5 (pipeline only) | –40% |
| Air defense interceptor usage | 0 | 575+ engagements | $1.5B–$3B cost |
| PIF investment allocation | Megaprojects focus | Food security pivot | Strategic shift |
| GDP growth forecast | +4.1% | –3% (Goldman) | –7.1pp swing |
| Gold reserves value | Baseline | +40% (gold surge) | SAMA windfall |
| External debt | $156B | $156B | More serviceable |
The deepest irony of the war’s economics is temporal. The costs are front-loaded and certain; the benefits, if they exist, are deferred and speculative. The United States has spent $25 billion to $40 billion on the hope that destroying Iran’s nuclear programme prevents a greater future cost. Iran has absorbed $50 billion to $85 billion in damage to defend a political system that may not survive the war regardless. Saudi Arabia has spent billions on interceptors while earning billions from oil prices, a wash that leaves the Kingdom strategically stronger but existentially no safer. The war has already cost more than any plausible version of victory can return.
Frequently Asked Questions
How much has the Iran war cost the United States in total?
The Pentagon disclosed $11.3 billion in spending for the first six days alone. Cumulative costs through Day 26 are estimated between $25 billion and $40 billion depending on accounting methodology. Defense Secretary Hegseth has requested an additional $200 billion in supplemental funding from Congress, signalling the administration expects months of continued operations.
What is Saudi Arabia’s net financial position from the war?
Saudi Arabia faces approximately $6.5 billion to $8.5 billion in direct costs including interceptor expenditure, infrastructure damage, and lost oil revenue. However, the oil price surge generates roughly $119 million per day in additional revenue, and the Kingdom’s fiscal balance has swung from a 5.3 percent deficit to an estimated 8 to 10 percent surplus at current prices, creating a partially offsetting windfall.
Why does air defense cost so much more than the drones it shoots down?
Iran’s Shahed-136 drones cost between $20,000 and $50,000 to produce, while the Patriot PAC-3 interceptors used against them cost $2 million to $4 million each and THAAD interceptors cost $12.77 million each. This creates a cost ratio as extreme as 200-to-1 in favour of the attacker, a structural asymmetry that no defense budget can sustain indefinitely at current engagement rates.
How much has the Iran war cost the global economy?
Chatham House projects global GDP losses between $590 billion and $3.5 trillion depending on the war’s duration, representing 0.54 to 3.15 percent of global output. The IEA has characterised the disruption as the greatest global energy security challenge in history, surpassing the 1970s oil shocks in both severity and geographic scope.
Who is profiting most from the Iran war?
Defense contractors lead the gains, with RTX Corporation up 110 percent, Northrop Grumman up 60 percent, and General Dynamics up 57 percent. Russia has increased oil exports to China by 300,000 barrels per day while benefiting from higher global prices. Gold has surged past $5,300 per ounce, enriching central banks and commodity investors. Saudi Arabia paradoxically benefits from oil price appreciation even as it bears significant direct costs from Iranian attacks.
What will reconstruction cost after the war ends?
Iran’s reconstruction needs are estimated at tens of billions of dollars at minimum, with energy infrastructure repair timelines measured in years rather than months. The global military rearmament cycle triggered by the war will push worldwide defence spending past $3 trillion annually by 2027, according to trends extrapolated from SIPRI data. The permanent war premium on Gulf shipping insurance adds long-term costs that will persist regardless of the conflict’s outcome.