
DHAHRAN — Twenty-two days of war between Iran and the United States have produced the most severe disruption to global energy markets since the Arab oil embargo of 1973, with Brent crude surging past $119 a barrel before settling near $113 on March 19, fertilizer shipments stranded across the Persian Gulf, and central banks on three continents frozen between fighting inflation and preventing recession. The International Energy Agency has called it “the greatest global energy and food security challenge in history.” For Saudi Arabia, the kingdom that sits atop the world’s largest spare production capacity, the crisis presents a paradox that no volume of crude can resolve: the oil is there, but the routes to deliver it are not.
The war’s economic toll now extends far beyond the Persian Gulf. Jet fuel has doubled in price. Urea fertilizer has surged 32 percent in a single week. United Airlines has cut five percent of its flights. The World Food Programme projects 45 million additional people at risk of acute hunger. And the European Central Bank, which had been preparing to cut interest rates for the first time since 2024, has instead raised its inflation forecast from 2.0 to 2.6 percent. What began as a military operation against Iran’s nuclear programme has metastasised into the defining economic event of the decade.
Table of Contents
- What Makes This Oil Shock Different From 1973?
- Anatomy of the Disruption
- How High Will Oil Prices Go Before the War Ends?
- The Central Bank Dilemma Nobody Saw Coming
- Is the Iran War About to Trigger a Global Food Crisis?
- How Does $113 Oil Ripple Through the Petrochemical Supply Chain?
- The Airline Industry’s $11 Billion Problem
- The Oil Shock Severity Index
- Why Has Global Shipping Become Unaffordable?
- Who Suffers Most From $113 Oil?
- Saudi Arabia’s Dangerous Windfall
- Can OPEC Fix a Crisis Its Members Cannot Ship Through?
- The War That Advanced the Energy Transition by a Decade
- What Happens When the Strait of Hormuz Reopens?
- Frequently Asked Questions
What Makes This Oil Shock Different From 1973?
The 2026 oil shock is structurally more dangerous than the 1973 Arab embargo, the 1979 Iranian Revolution, and the 2008 commodity spike combined. In 1973, the disruption resulted from a political decision by OPEC producers to restrict supply — a tap that could theoretically be reopened the moment politics changed. Approximately 4.4 million barrels per day were removed from the market during the 1973 embargo, according to historical data compiled by the US Energy Information Administration. Prices rose roughly 300 percent, from $3 to nearly $12 per barrel.
The 2026 disruption involves something far harder to reverse. An estimated 20 million barrels per day normally transits the Strait of Hormuz — roughly 20 percent of global oil consumption, according to the EIA. The strategic logic of Iran’s selective blockade versus total closure reveals why Tehran’s latest threat may accelerate its own economic collapse. Since Iran declared the strait closed on March 2, only 21 tankers have completed the passage, according to S&P Global Market Intelligence, compared with more than 100 ships daily before the conflict. The disruption is not merely political. It is physical: minefields, drone strikes, insurance market collapse, and infrastructure damage have combined to create a blockage that cannot be unwound by a single diplomatic decision.
Three factors distinguish this shock from its predecessors. First, the sheer volume at stake dwarfs any previous disruption. Second, the damage extends beyond oil to liquefied natural gas, petrochemicals, and fertilizers that also transit the strait. Third, the insurance market — the invisible infrastructure that makes global trade possible — has effectively ceased to function in the Persian Gulf, meaning that even if hostilities paused tomorrow, commercial shipping would not resume for weeks while underwriters reassessed risk.
Anatomy of the Disruption
The economic damage from the Iran war operates through five distinct transmission channels, each reinforcing the others in a cascading spiral that has no precedent in modern energy history.
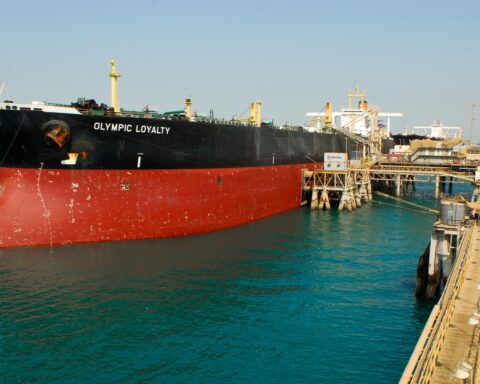
The first channel is the crude oil supply cut. Saudi Arabia’s crude supply has declined by an estimated 2.4 million barrels per day, falling to approximately 8 million barrels per day in March, according to S&P Global Commodity Insights. The kingdom has increasingly diverted exports to the Red Sea port of Yanbu via the 1,200-kilometre East-West Pipeline, but that route’s capacity of roughly 5 million barrels per day cannot compensate for the loss of the Eastern Province terminals that normally handle the bulk of Saudi exports. Saudi Arabia has the oil the world needs but no viable way to deliver it at the volumes required to stabilise markets.
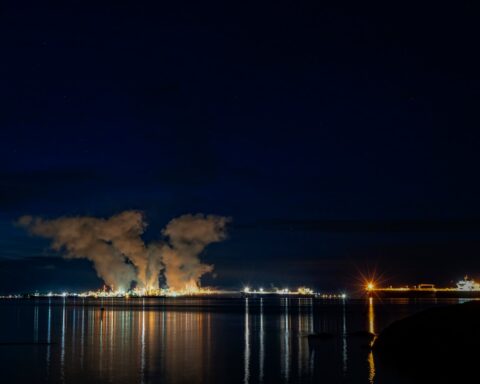
The second channel is the natural gas and LNG disruption. Qatar, the world’s largest LNG exporter, routes its cargoes through the Strait of Hormuz. Iran’s strike on the Ras Laffan LNG complex hit a facility that has no geographic bypass. Unlike oil, which can at least partially be rerouted through pipelines, LNG infrastructure is fixed and takes years to replicate.
The third channel is fertilizer. The Gulf produces 44 percent of the world’s traded sulfur, a critical input for phosphate fertilizers, according to the Carnegie Endowment for International Peace. Nearly one-third of global seaborne fertilizer trade passes through the Strait of Hormuz. With nearly one million metric tons of fertilizer physically stranded in the Gulf, the disruption threatens not just energy markets but the global food supply.
The fourth channel is shipping costs. The blockade has forced commercial vessels to reroute around the southern tip of Africa, adding approximately 6,000 nautical miles and two weeks to voyages between the Persian Gulf and Europe. Freight rates on major tanker routes have increased by 300 to 400 percent since the war began, according to Clarksons Research. Insurance markets have all but ceased underwriting Gulf cargo, compounding the cost for any shipment that does move.
The fifth channel is the confidence effect. Businesses from Tokyo to Toronto are delaying investment decisions. Consumer spending in energy-importing nations has begun to contract as fuel costs absorb a growing share of household budgets. Bloomberg Economics estimates that the war has already reduced projected global GDP growth by 0.4 percentage points for 2026.
How High Will Oil Prices Go Before the War Ends?
Brent crude has risen from approximately $70 per barrel before the conflict to $113.71 on March 19, an increase of more than 60 percent in less than three weeks. On March 20, prices briefly surged past $119 before retreating sharply on reports of potential ceasefire discussions that later proved premature. The peak so far — approximately $120 — was reached in the first week of March and matches the highs seen during the initial phase of Russia’s invasion of Ukraine in March 2022.
Morgan Stanley’s commodity research team warned in a March 14 note that sustained closure of the Strait of Hormuz could push Brent to $150 per barrel within four to six weeks, a level last approached briefly during the 2008 commodity supercycle. United Airlines CEO Scott Kirby went further, warning investors that oil could reach $175 per barrel and estimating the potential cost to his airline alone at $11 billion annually.
The price trajectory depends on three variables. Duration of the Hormuz closure is the most important: each additional week adds roughly $8 to $12 per barrel in risk premium, according to Goldman Sachs commodity research. The second variable is the pace of strategic petroleum reserve releases — the IEA has already authorised a record 400 million barrels, but member nations’ reserves are finite. The third variable is whether Iranian attacks on Gulf oil infrastructure intensify, potentially removing production capacity rather than merely blocking transit routes.
The most dangerous scenario is not the headline price but the duration. A two-week spike to $120 is manageable. A six-month plateau above $100 would trigger the kind of structural economic damage — bankruptcies, demand destruction, investment collapse — that took the global economy years to recover from after both the 1973 and 1979 shocks.
The Central Bank Dilemma Nobody Saw Coming
Central bankers entered 2026 expecting to celebrate victory over the post-pandemic inflation surge. The Federal Reserve had cut rates cautiously through 2024 and 2025. The European Central Bank was preparing its first rate reduction in over two years. The Bank of Japan had finally begun normalising policy after decades of negative rates. The Iran war shattered every one of those plans within a fortnight.
The Federal Reserve held its benchmark rate unchanged at its March meeting, with Chair Jerome Powell acknowledging that the conflict had made the economic outlook “significantly more uncertain.” The Fed’s updated projections raised the 2026 inflation forecast to 2.7 percent, up from 2.5 percent in December, according to the Federal Open Market Committee’s Summary of Economic Projections. More telling than the number was the language: the committee dropped its previous characterisation of inflation risks as “roughly balanced” and replaced it with a formulation that acknowledged “upside risks” to prices.
The ECB faces an even more acute dilemma. Europe imports approximately 90 percent of its crude oil and a significant share of its natural gas from external sources. The central bank’s March staff projections raised the headline inflation forecast from 2.0 percent to 2.6 percent for 2026, while cutting the growth forecast from 1.2 percent to 0.9 percent, according to the ECB’s official press release. ECB President Christine Lagarde warned that the energy shock had created “upside risks to inflation and downside risks to growth” — the textbook definition of stagflation.
Japan’s situation is perhaps the most precarious. The Bank of Japan had finally ended negative interest rates in 2024, but the country imports virtually all of its oil and was already dealing with a historically weak yen. Inflation in Japan is forecast to reach 2.5 percent year-on-year by mid-2026, according to Morgan Stanley, complicating the central bank’s delicate normalisation.
The dilemma confronting all three institutions is identical: raise rates to fight inflation and risk tipping already-weakened economies into recession, or hold rates steady and allow an energy-driven price spiral to become entrenched. In 1973 and 1979, central banks chose to tighten aggressively, producing deep recessions. Whether today’s policymakers have the appetite to repeat that medicine remains the single most consequential unanswered question in global economics.
Is the Iran War About to Trigger a Global Food Crisis?
The war’s most devastating economic consequence may not be felt at the petrol pump but at the dinner table. The Strait of Hormuz blockade has severed a critical link in the global food supply chain by trapping nearly one million metric tons of fertilizer in Gulf ports, according to estimates by the Food and Agriculture Organization of the United Nations.
Urea prices at the New Orleans import hub — the benchmark for North American farmers — surged from $516 per metric ton on February 27 to $683 per metric ton by March 5, a 32 percent increase in a single week, according to Bloomberg commodity data. The cost of one ton of urea now requires the equivalent of 126 bushels of corn to purchase, up from 75 bushels in December 2025. For American farmers entering the spring planting season, those economics make certain crops unprofitable to plant at all.
The fertilizer crisis extends beyond urea. The Gulf produces 44 percent of global sulfur supply, a critical raw material for phosphate fertilizer production, according to the Carnegie Endowment for International Peace. India, which sources more than 40 percent of its urea and phosphate fertilizers from the Middle East, faces particular vulnerability. Over 90 percent of the fertilizer consumed in sub-Saharan Africa is imported from outside the continent, making the region acutely exposed to any disruption in Gulf supply chains.
The World Food Programme projects that almost 45 million additional people could be pushed into acute hunger if the conflict does not end by mid-year, adding to the 318 million worldwide who are already food-insecure. Import-dependent countries in Africa and Asia face the highest risk, with some nations experiencing a projected 24 percent rise in extreme hunger, according to WFP modelling. Energy cost pass-through accounts for roughly half the total retail food bill in most economies, meaning that $113 oil translates directly into higher bread, rice, and meat prices for consumers who are already spending the majority of their income on food.
The timing compounds the damage. The Northern Hemisphere spring planting window is a fixed biological deadline. Even if the Strait of Hormuz opened tomorrow, restarting fertilizer production and transport would take weeks — weeks that American, European, and South Asian farmers do not have. Decisions not to plant, or to plant with reduced fertilizer application, cannot be reversed after the season passes. The food price inflation from the 2026 oil shock will therefore persist well into 2027 regardless of when the war ends.
How Does $113 Oil Ripple Through the Petrochemical Supply Chain?
Oil is not merely a fuel. It is the foundational feedstock for plastics, synthetic fibres, pharmaceuticals, detergents, and thousands of industrial chemicals that underpin modern manufacturing. Approximately 14 percent of global crude oil production is consumed by the petrochemical industry rather than burned for energy, according to the International Energy Agency. The 2026 price shock has hit this sector with particular severity because petrochemical producers operate on thin margins that cannot absorb a 60 percent increase in input costs.
Naphtha — the primary petrochemical feedstock derived from crude oil — has risen from approximately $620 per metric ton in February to over $900 per metric ton in mid-March, according to ICIS pricing data. European ethylene crackers, which convert naphtha into the building block for polyethylene plastics, have seen margins turn negative. At least four major crackers in Belgium and the Netherlands have reduced operating rates to 70 percent of capacity, according to industry reports. The result is a cascading shortage of plastics, resins, and packaging materials that will reach consumer shelves within four to eight weeks.
The pharmaceutical industry faces its own exposure. Over 80 percent of active pharmaceutical ingredients consumed in the United States are manufactured abroad, according to the FDA, with significant dependence on petrochemical-derived precursors. The Gulf region produces substantial volumes of methanol, a precursor for numerous pharmaceutical compounds. Supply chain managers at major pharmaceutical companies are quietly stockpiling critical inputs, according to Reuters, a defensive measure that itself exacerbates shortages.
For Saudi Arabia, the petrochemical disruption carries a particular irony. Saudi Arabia Basic Industries Corporation (SABIC), one of the world’s largest petrochemical companies and a subsidiary of Aramco, had positioned itself as a cornerstone of the kingdom’s non-oil industrial strategy. The company’s integrated operations — converting Saudi crude into plastics, fertilizers, and specialty chemicals — generate higher margins than raw crude exports. But with export routes blocked and regional industrial customers curtailing operations, SABIC’s production advantage has become a logistical liability.
The Airline Industry’s $11 Billion Problem
Jet fuel prices, which had stabilised between $85 and $90 per barrel before the conflict, surged to between $150 and $200 per barrel in the first three weeks of March, according to data compiled by IATA. The increase has cascaded through the global aviation industry with unusual speed, as airlines scramble to protect margins that were already thin after years of post-pandemic recovery.
Average domestic airfares in the United States have climbed by between 15 and 124 percent for bookings in late March and April, depending on route and carrier, according to fare-tracking data cited by the Washington Post. Transcontinental flight prices have jumped over 100 percent. Airlines including Cathay Pacific, AirAsia, Thai Airways, and multiple European carriers have imposed fuel surcharges ranging from $50 to $200 per ticket, according to Euronews.
United Airlines announced a five percent reduction in scheduled flights for the second and third quarters of 2026, the most significant capacity cut by a major US carrier since the early months of the Covid-19 pandemic. CEO Scott Kirby warned investors that oil at sustained levels above $110 could add an estimated $11 billion to the airline’s annual fuel expenses, effectively wiping out its projected operating profit for the year. Delta Air Lines and American Airlines have signalled similar capacity reviews.
The aviation industry’s pain extends beyond fare increases. The rerouting of international flights away from Iranian, Iraqi, and Gulf airspace has added hours to journeys between Europe and Asia-Pacific, increasing fuel burn per flight. Several carriers have suspended or dramatically reduced service to Gulf destinations, further isolating a region that had positioned itself as a global aviation hub. Emirates, Qatar Airways, and Saudi Arabian Airlines — the three Gulf megacarriers — face the dual challenge of higher fuel costs and reduced demand as business and leisure travellers defer travel to the region.
The Oil Shock Severity Index
Not all oil shocks are equal. The defining characteristics that separate a short-term price spike from a structural economic transformation involve duration, volume, geography, alternatives, and institutional response. Measured across these five dimensions, the 2026 disruption exceeds every previous oil shock in modern history on at least three of five criteria.
| Dimension | 1973 Arab Embargo | 1979 Iranian Revolution | 2008 Commodity Spike | 2026 Iran War |
|---|---|---|---|---|
| Peak price increase | ~300% | ~150% | ~100% | ~95% (and rising) |
| Supply removed (mb/d) | 4.4 | 3.9 | 0 (demand-driven) | ~8.0 (physical blockade) |
| Duration | 5 months | ~12 months | ~6 months | 22 days (ongoing) |
| Cause type | Political embargo | Revolution + war | Demand surge + speculation | Physical blockade + infrastructure damage |
| Reversibility | High (diplomatic) | Medium (regime change) | High (demand adjustment) | Low (mines, damage, insurance) |
| Geographic scope | Middle East exporters | Iran only | Global demand | Entire Persian Gulf |
| Non-oil disruption | Minimal | Moderate | Minimal | Severe (LNG, fertilizer, chemicals) |
| SPR available | None (pre-SPR era) | Limited | Substantial | Depleted from 2022 releases |
The index reveals a disturbing pattern. The 2026 shock scores highest on supply removal, geographic scope, non-oil disruption, and reversibility difficulty. The only dimension where it currently scores lower than 1973 is peak price increase — but the conflict is barely three weeks old and prices continue to climb. If the Strait of Hormuz remains closed through April, the price trajectory could match or exceed the 1973 level of tripling from the pre-crisis baseline.
The reversibility dimension deserves particular attention. In 1973, the embargo ended with a political decision by Arab producers. Supply was restored within weeks. In 2026, even a ceasefire would not immediately restore shipping. Iran has deployed sea mines across the strait’s shipping lanes. Insurance markets require weeks of stability before resuming coverage. Damaged port infrastructure needs repair. Crews who fled the region must be recruited. The gap between “the shooting stops” and “oil flows normally” could stretch to three months or longer, according to maritime logistics analysts at Wood Mackenzie.
Who Suffers Most From $113 Oil?
The distributional impact of the oil shock is starkly unequal. Wealthy, energy-efficient economies in Northern Europe and East Asia absorb the blow through fiscal buffers and diversified energy mixes. Developing nations in Sub-Saharan Africa, South Asia, and Southeast Asia face an existential threat to food security, currency stability, and social cohesion.
The United Nations World Food Programme has identified 23 countries at acute risk, where the combination of oil-driven food price inflation, fertilizer shortages, and currency depreciation could push food insecurity to levels not seen since the worst months of the 2011 Arab Spring — itself triggered partly by food price spikes. Countries including Ethiopia, Pakistan, Bangladesh, Nigeria, and Egypt spend disproportionate shares of GDP on food and energy imports, leaving them with no fiscal room to subsidise consumption as prices rise.
India presents a particularly complex case. The country imports approximately 85 percent of its crude oil and sources more than 40 percent of its urea and phosphate fertilizers from the Middle East. India’s fertilizer subsidy bill, already budgeted at approximately $20 billion for fiscal year 2026-27, could increase by 30 to 40 percent if Gulf supplies remain disrupted, according to estimates by CRISIL, an Indian credit rating agency. The Indian rupee has depreciated approximately 4 percent against the US dollar since the war began, compounding the cost of dollar-denominated imports.
Sub-Saharan Africa faces perhaps the most acute vulnerability. Over 90 percent of the fertilizer consumed in the region is imported, mostly from outside the continent. The combination of higher fuel costs, higher fertilizer prices, and currency depreciation against the dollar creates a triple squeeze on farmers who were already operating at subsistence margins. The African Development Bank estimates that each $10 increase in the oil price reduces GDP growth across the continent by approximately 0.3 percentage points.
| Region | Oil Import Dependency | Fertilizer Import Dependency | Food Expenditure (% of Income) | Currency Pressure | Vulnerability Rating |
|---|---|---|---|---|---|
| Sub-Saharan Africa | ~80% | 90%+ | 40-60% | Severe | Critical |
| South Asia (India, Bangladesh, Pakistan) | 80-85% | 40-60% | 30-50% | High | Critical |
| Southeast Asia | 60-80% | 30-50% | 25-40% | Moderate | High |
| European Union | ~90% | 20-30% | 12-15% | Low | Moderate |
| United States | ~40% | 15-20% | 10-12% | None (reserve currency) | Low-Moderate |
| Japan / South Korea | 95%+ | Variable | 15-20% | Moderate | High |
Why Has Global Shipping Become Unaffordable?
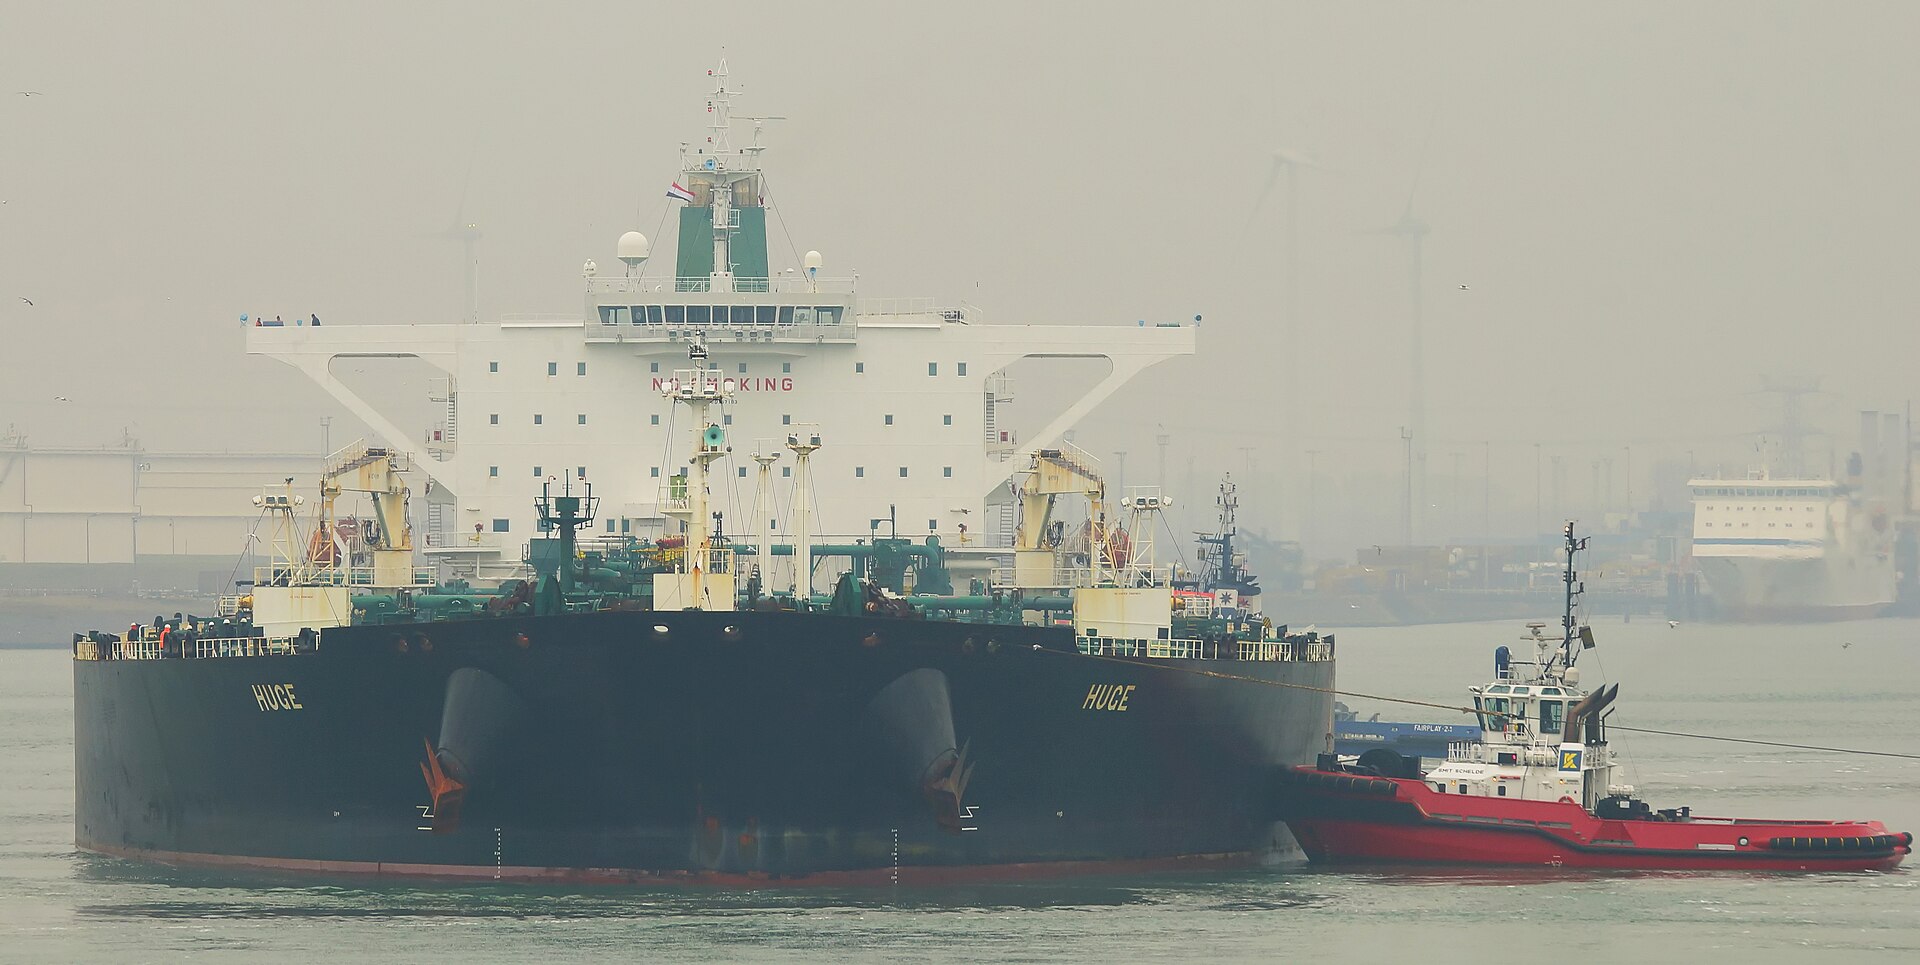
The Hormuz blockade has forced the largest rerouting of global shipping since the closure of the Suez Canal in 1967. Commercial vessels carrying crude oil, LNG, petrochemicals, and dry cargo between the Persian Gulf and European or East Asian ports must now transit via the Cape of Good Hope at the southern tip of Africa, adding approximately 6,000 nautical miles and 12 to 14 days to each voyage. The financial consequences have been immediate and severe.
Freight rates on the benchmark Middle East Gulf-to-Japan tanker route have increased by approximately 350 percent since the war began, according to Clarksons Research, the world’s leading shipping data provider. A voyage that cost roughly $2 million in freight charges in February now costs $7 million or more. The Baltic Dirty Tanker Index, which tracks rates for crude oil transport, has reached levels not seen since the first Gulf War in 1991.
Container shipping has been equally disrupted. Maersk, the world’s second-largest container line, announced on March 10 that it would suspend all bookings to and from ports in Bahrain, Kuwait, and eastern Saudi Arabia until further notice. CMA CGM and Hapag-Lloyd followed with similar announcements. The container shipping disruption compounds the oil shock by interrupting the flow of manufactured goods, consumer electronics, and industrial components that depend on Gulf port infrastructure.
For Saudi Arabia, the shipping crisis undermines a key Vision 2030 objective. The kingdom had invested heavily in King Abdullah Port and Jeddah Islamic Port as logistics hubs connecting Asia and Europe. Those investments assumed open sea lanes and competitive freight rates. The war has destroyed both assumptions, and even after hostilities end, elevated insurance premiums and risk surcharges will keep Saudi shipping costs above pre-war levels for years.
Saudi Arabia’s Dangerous Windfall
Conventional wisdom treats any oil price surge as a windfall for Saudi Arabia. Petrodollar revenues flood the treasury. The Public Investment Fund’s war chest swells. Riyadh’s geopolitical leverage increases. This narrative is dangerously incomplete.
The kingdom is indeed earning more per barrel — but it is selling fewer barrels. Saudi crude supply has declined to approximately 8 million barrels per day from its pre-war level of over 10 million barrels per day, as the Hormuz blockade and Aramco’s unprecedented operational crisis constrain exports. The net revenue effect is positive but far smaller than the headline price would suggest. At 8 million barrels per day and $113 per barrel, Saudi oil revenues are roughly $904 million daily — compared with approximately $700 million daily at the pre-war 10 million barrels per day and $70 per barrel. A 29 percent revenue increase sounds impressive until measured against the costs the war has imposed.
Those costs are accumulating rapidly. Luxury hotel bookings across the kingdom fell an estimated 45 percent during the first two weeks of March, according to hospitality industry data, threatening a tourism sector that had become a cornerstone of Vision 2030’s diversification strategy. Foreign direct investment flows have slowed as multinational corporations reassess Gulf risk. NEOM construction contracts have been cancelled. Insurance premiums for Saudi industrial facilities have quintupled. The kingdom is simultaneously earning more from oil and spending more to defend, insure, and market itself.
The deeper danger is structural. Every previous oil shock has accelerated the global energy transition. The 1973 embargo produced nuclear power programmes across Europe and Japan. The 1979 shock drove the first wave of fuel efficiency standards. The 2008 spike catalysed the modern electric vehicle industry. Saudi Arabia’s entire economic future depends on oil demand remaining robust through at least 2040 — the timeline required for Vision 2030’s non-oil economy to reach self-sustaining scale. Each month that oil trades above $100 per barrel, governments from Berlin to Beijing accelerate investments in alternatives that permanently destroy future demand for Saudi crude.
The tragedy for Saudi Arabia is that the weapon being used against Iran — the oil price — is simultaneously the weapon being used against Riyadh’s own future. Every barrel sold at $113 today is a barrel of demand that will never return once the world finishes building the infrastructure to avoid needing it.
Energy market analysis, March 2026
Can OPEC Fix a Crisis Its Members Cannot Ship Through?
On March 1, eight OPEC+ countries including Saudi Arabia and Russia agreed to resume unwinding voluntary production cuts, approving a 206,000 barrel-per-day increase effective April 2026, according to the group’s official communiqué. The decision was widely interpreted as an attempt to signal to nervous markets that supply would be forthcoming. It has had almost no effect on prices.
The reason is brutally simple: OPEC can authorise additional production, but it cannot authorise additional shipping capacity through a blockaded strait. Saudi Arabia and the UAE can pump more oil, but the additional barrels have nowhere to go. The East-West Pipeline to Yanbu is already operating near capacity. The UAE’s Abu Dhabi Crude Oil Pipeline to Fujairah on the Arabian Sea handles only a fraction of the country’s output. Iraq’s southern export terminal at Basra has been damaged by Iranian drone strikes.
OPEC’s impotence in this crisis exposes a structural vulnerability that energy markets had long dismissed. The organisation’s pricing power has always rested on the assumption that its members could freely ship their production to market. The Hormuz blockade has severed that assumption. Saudi Arabia has the world’s largest spare production capacity — estimated at approximately 1.5 to 2.0 million barrels per day — but spare capacity is meaningless if the oil cannot reach refineries in Asia, Europe, and North America.
Russia, the other dominant OPEC+ producer, faces different constraints. Western sanctions, though partially lifted for oil by the Trump administration on March 13, still restrict Russian access to Western shipping insurance and financial infrastructure. Russian crude trades at a persistent discount to Brent, limiting Moscow’s ability to profit from the crisis. The irony is that the two nations most capable of flooding the market with oil — Saudi Arabia and Russia — are both constrained by logistics rather than geology.
The War That Advanced the Energy Transition by a Decade
The conventional narrative frames the Iran war as a disaster for clean energy because high oil prices make fossil fuels profitable again. The evidence suggests precisely the opposite. High oil prices do not encourage investment in new oil production — they encourage investment in alternatives that render oil production unnecessary.
European Commission President Ursula von der Leyen announced an emergency energy meeting on March 16, at which member states agreed to accelerate the EU’s renewable energy targets by 18 months. Germany fast-tracked approvals for three offshore wind farms. France announced a €2 billion supplement to its heat pump subsidy programme. The United Kingdom brought forward its ban on new petrol car sales from 2035 to 2032. None of these decisions would have been politically feasible at $70 oil. At $113, they became inevitable.
In Asia, Japan and South Korea — the world’s fourth and fifth largest oil importers — have accelerated nuclear restart programmes. Japan’s Ministry of Economy, Trade and Industry authorised the restart of three additional nuclear reactors under emergency provisions, bypassing normal regulatory review timelines. South Korea reversed its nuclear phase-out policy entirely. China, which had already planned 150 gigawatts of new solar capacity for 2026, raised its target to 200 gigawatts.
Electric vehicle sales provide perhaps the clearest barometer. Tesla reported a 34 percent increase in European orders during the first two weeks of March compared with the same period in February, according to company disclosures. BYD’s European order book doubled. In India, Tata Motors reported a 45 percent surge in EV enquiries. The pattern mirrors what happened after the 2022 oil spike during the Ukraine war, but at greater magnitude and speed.
The implications for Saudi Arabia are profound. Every solar panel installed, every EV purchased, every heat pump activated during this crisis represents permanent demand destruction for oil. Unlike a temporary shortage, a structural shift in the energy system does not reverse when prices normalise. The demand destroyed during the 1973 shock — through nuclear power and fuel efficiency — never returned to oil. The same dynamic is now unfolding at global scale, at a pace that could compress a decade of normal transition into two or three years.
What Happens When the Strait of Hormuz Reopens?
The eventual reopening of the Strait of Hormuz will not produce the instantaneous price normalisation that markets expect. Three structural obstacles will delay the return to pre-war conditions by months, not weeks.
First, de-mining operations. Iran has deployed an unknown number of naval mines across the strait’s shipping lanes. The US Navy’s mine countermeasures force — comprising approximately 10 dedicated vessels and several helicopter squadrons — requires weeks to clear a single shipping lane to a confidence level that commercial insurers will accept. Wood Mackenzie’s maritime logistics team estimates a minimum of four to six weeks for initial clearance, with full certification taking up to three months.
Second, the insurance reset. Lloyd’s of London and the major reinsurance markets in Munich and Zurich have effectively suspended coverage for Persian Gulf voyages. Reinstating coverage requires not just an end to hostilities but a demonstrated period of stability — typically 30 to 60 days without hostile action. Shipowners will not risk billion-dollar vessels without coverage, regardless of military assurances.
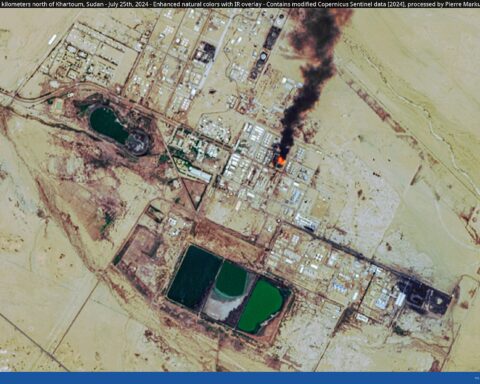
Third, infrastructure repair. Iranian drone and missile strikes have damaged port facilities, loading terminals, and pipeline infrastructure across the Gulf. Aramco’s operational crisis includes damaged loading berths at Ras Tanura, the world’s largest offshore oil loading facility. Repairs to precision industrial infrastructure cannot be rushed without compromising safety standards.
The cumulative effect of these obstacles means that even an immediate ceasefire would produce only a gradual, multi-month recovery in Gulf oil and gas exports. Markets that have priced in a rapid snapback may face a second shock when the slow pace of normalisation becomes apparent.
| Phase | Duration | Oil Flow Recovery | Key Constraint |
|---|---|---|---|
| Ceasefire declared | Week 1 | 0% | Mine clearance must begin |
| Initial lane clearance | Weeks 2-6 | 10-20% | Military escorts required, no insurance |
| Insurance markets reopen | Weeks 6-12 | 40-60% | Premium surcharges remain elevated |
| Infrastructure repairs | Months 3-6 | 70-85% | Damaged loading terminals limit throughput |
| Full normalisation | Months 6-12 | 95-100% | Crew recruitment, vessel repositioning |
Frequently Asked Questions
How does the 2026 oil shock compare to the 1973 oil crisis?
The 2026 disruption involves approximately 8 million barrels per day of supply removal through the Hormuz blockade, compared with 4.4 million barrels per day during the 1973 Arab embargo. The 1973 crisis was a political embargo that could be reversed diplomatically. The 2026 crisis involves physical blockade, mines, infrastructure damage, and insurance market collapse, making it structurally harder to reverse even after a ceasefire.
Why can’t Saudi Arabia just pump more oil to lower prices?
Saudi Arabia has approximately 1.5 to 2.0 million barrels per day of spare production capacity, but the kingdom’s primary export route through the Strait of Hormuz is blocked. The East-West Pipeline to the Red Sea port of Yanbu operates near its 5 million barrel-per-day capacity. Additional production cannot reach global markets until the strait reopens or new pipeline capacity is built — a process that takes years, not weeks.
Will the oil shock cause a global recession?
Bloomberg Economics estimates the war has already reduced projected 2026 global GDP growth by 0.4 percentage points. The ECB cut its eurozone growth forecast from 1.2 to 0.9 percent. Whether this slowing becomes an outright recession depends on duration: a two-month disruption is manageable, while a six-month closure of Hormuz would likely push Europe and several Asian economies into contraction, according to the IMF’s stress-test models.
How is the oil shock affecting food prices worldwide?
The Hormuz blockade has stranded nearly one million metric tons of fertilizer in Gulf ports. Urea prices surged 32 percent in a single week. The World Food Programme projects 45 million additional people at risk of acute hunger. The disruption coincides with the Northern Hemisphere spring planting window, meaning reduced fertilizer application this season will affect harvests through late 2026 and into 2027.
When will oil prices return to normal?
Even after a ceasefire, maritime logistics analysts estimate three to six months before Gulf oil exports return to 70-85 percent of pre-war levels, due to mine clearance, insurance market recovery, and infrastructure repairs. Full normalisation could take six to twelve months. Oil prices are unlikely to return to the pre-war $70 range during 2026, with most forecasters projecting a sustained premium of $15 to $30 per barrel for at least a year after hostilities end.
Is the 2026 oil shock accelerating the energy transition?
Significantly. The EU has accelerated renewable energy targets by 18 months. Japan and South Korea have fast-tracked nuclear reactor restarts. Electric vehicle orders in Europe surged 34 percent in the first two weeks of March. Every previous oil shock has produced permanent demand destruction through investment in alternatives, and the 2026 crisis is following the same pattern at unprecedented scale and speed.