RIYADH — The Saudi riyal has held its peg to the United States dollar at 3.75 for nearly four decades, surviving oil crashes, succession crises, and regional wars without so much as a tremor. Now, twelve days into the most destructive conflict the Persian Gulf has witnessed since 1991, the currency anchor that underwrites every megaproject, every sovereign debt issuance, and every barrel of Saudi crude sold anywhere on earth faces a convergence of pressures that no central banker in Riyadh ever modelled. The Strait of Hormuz is functionally closed, slashing the Kingdom’s primary oil export route. Defence spending is surging at a pace unseen since the Gulf War. Capital is leaving the region at rates that Gulf sovereign wealth funds are only beginning to acknowledge. And the Saudi Arabian Monetary Authority — SAMA — is burning foreign reserves to defend a fixed exchange rate while the revenue pipeline that replenishes those reserves runs dry.
The numbers are stark. SAMA entered the war with approximately $448 billion in net foreign assets, a comfortable buffer by peacetime standards but one that conceals a dangerous asymmetry: Saudi Arabia’s monthly import bill, defence obligations, and Vision 2030 capital commitments now exceed the oil revenue the Kingdom can actually collect while Hormuz remains contested. The question confronting Riyadh is not whether the peg will survive the next twelve days. It is whether the monetary architecture that has anchored Saudi economic life since 1986 can withstand a siege economy of uncertain duration — and what happens to a Kingdom built on dollar-denominated promises if it cannot.
Table of Contents
- What Is the Saudi Riyal’s Dollar Peg and Why Does It Matter?
- How Much Are SAMA’s Foreign Reserves Worth in March 2026?
- The Revenue Paradox — High Oil Prices, Low Oil Exports
- How the 2015 Oil Crash Nearly Broke the Peg
- The Five Wartime Drains on SAMA’s Balance Sheet
- Is Saudi Arabia Spending Reserves Faster Than It Earns Them?
- The PIF Liquidity Trap — When a $913 Billion Fund Cannot Write Cheques
- Gulf Capital in Flight — The $2 Trillion Rethink
- The Peg Pressure Index — Measuring What Markets Cannot See
- What Happens If the Saudi Riyal Devalues?
- Is the Tadawul a Barometer for the Riyal?
- Saudi Arabia’s $100 Billion Debt Weapon
- The Contrarian Case — Why the Peg Will Hold
- Does the Federal Reserve’s Dilemma Help or Hurt Saudi Arabia?
- Frequently Asked Questions
What Is the Saudi Riyal’s Dollar Peg and Why Does It Matter?
The Saudi riyal has been fixed at 3.75 to the United States dollar since 1986, making it one of the longest-running currency pegs in the modern financial system. SAMA maintains this rate by holding vast reserves of dollars, U.S. Treasury securities, and other foreign-currency assets, buying or selling riyals as needed to prevent the exchange rate from moving. The peg functions as an economic constitution — every oil contract, every foreign worker’s remittance, every infrastructure bond, and every import invoice is priced against it.
For a petrostate that earns roughly 60 percent of its government revenue and 70 percent of its export income from hydrocarbons priced in dollars, the logic of a dollar peg is straightforward. It eliminates exchange-rate risk from the Kingdom’s most important transaction: selling oil. It provides monetary discipline by outsourcing interest-rate policy to the Federal Reserve. And it delivers a credibility signal to foreign investors that their capital, once converted to riyals, can be converted back at a predictable rate.
The cost of the peg, however, is sovereignty. SAMA cannot set interest rates independently — it must shadow the Fed’s decisions regardless of whether those rates suit Saudi domestic conditions. When the Fed raises rates to cool an overheating American economy, Saudi Arabia tightens too, even if its own economy needs stimulus. When the Fed cuts, Saudi Arabia must follow, even during periods of domestic inflation. The peg also requires SAMA to hold hundreds of billions in dollar-denominated assets that could otherwise be deployed into Vision 2030 megaprojects or domestic development. Every dollar in reserves is a dollar not invested in The Line, not deployed into a new refinery, not channelled into the entertainment sector.
The peg has survived previous stress tests — the 1990-91 Gulf War, the 2008 financial crisis, the 2014-2016 oil crash, the 2020 COVID demand collapse — but never under conditions where oil revenues were simultaneously high in price and low in volume, defence spending was spiking, and the physical infrastructure of oil export was under direct military attack.
How Much Are SAMA’s Foreign Reserves Worth in March 2026?
SAMA’s net foreign assets stood at approximately SR1.68 trillion — roughly $448 billion — as of January 2026, according to official central bank data. This represented a 10 percent year-on-year increase, driven by higher oil revenues through the second half of 2025 and disciplined fiscal management under Crown Prince Mohammed bin Salman’s economic reform programme. Arab News reported in February 2026 that reserves had reached a six-year high of $475 billion by the final quarter of 2025 before settling slightly lower in January.
These reserves are held across several categories: foreign securities (predominantly U.S. Treasury bonds), foreign currency deposits at international banks, gold holdings, and Saudi Arabia’s Special Drawing Rights position at the International Monetary Fund. SAMA does not disclose the exact breakdown in real time, but IMF Article IV consultation data from June 2025 estimated that roughly 65 percent of reserves were held in U.S. government and agency securities, 20 percent in foreign bank deposits, and the remainder in gold, SDRs, and other instruments.
| Date | Net Foreign Assets (USD bn) | Context |
|---|---|---|
| August 2014 (peak) | $737 | Pre-oil crash all-time high |
| March 2016 (post-crash trough) | $587 | After 20-month drawdown |
| April 2020 (COVID) | $464 | Demand collapse + OPEC price war |
| December 2022 | $428 | Post-pandemic recovery |
| Q4 2025 (pre-war peak) | ~$475 | Six-year high |
| January 2026 (latest) | ~$448 | Pre-war baseline |
The $448 billion figure sounds reassuring until it is measured against Saudi Arabia’s obligations. The Kingdom’s monthly import bill — food, industrial equipment, consumer goods, military hardware — runs at approximately $18-20 billion per month, according to General Authority for Statistics trade data. Vision 2030 capital expenditure commitments, including ongoing megaproject construction, drain an additional $8-12 billion monthly. Sovereign debt service adds another $2-3 billion per month across existing bond issuances. At a combined monthly outflow of $28-35 billion without any war-related spending, SAMA’s reserves provide roughly 13 to 16 months of cover — well below the 24-month threshold that currency markets typically regard as comfortable for a pegged economy.
The Revenue Paradox — High Oil Prices, Low Oil Exports
Brent crude traded at $90.96 per barrel on March 11, 2026, according to Fortune, down from a wartime peak above $119 but still roughly 50 percent higher than prices at the start of the year. Under normal circumstances, $90 oil would be a windfall for Saudi Arabia. At pre-war export volumes of approximately 7.4 million barrels per day, the Kingdom would generate roughly $666 million in daily crude revenue — more than enough to cover the budget deficit, rebuild reserves, and fund Vision 2030 simultaneously.
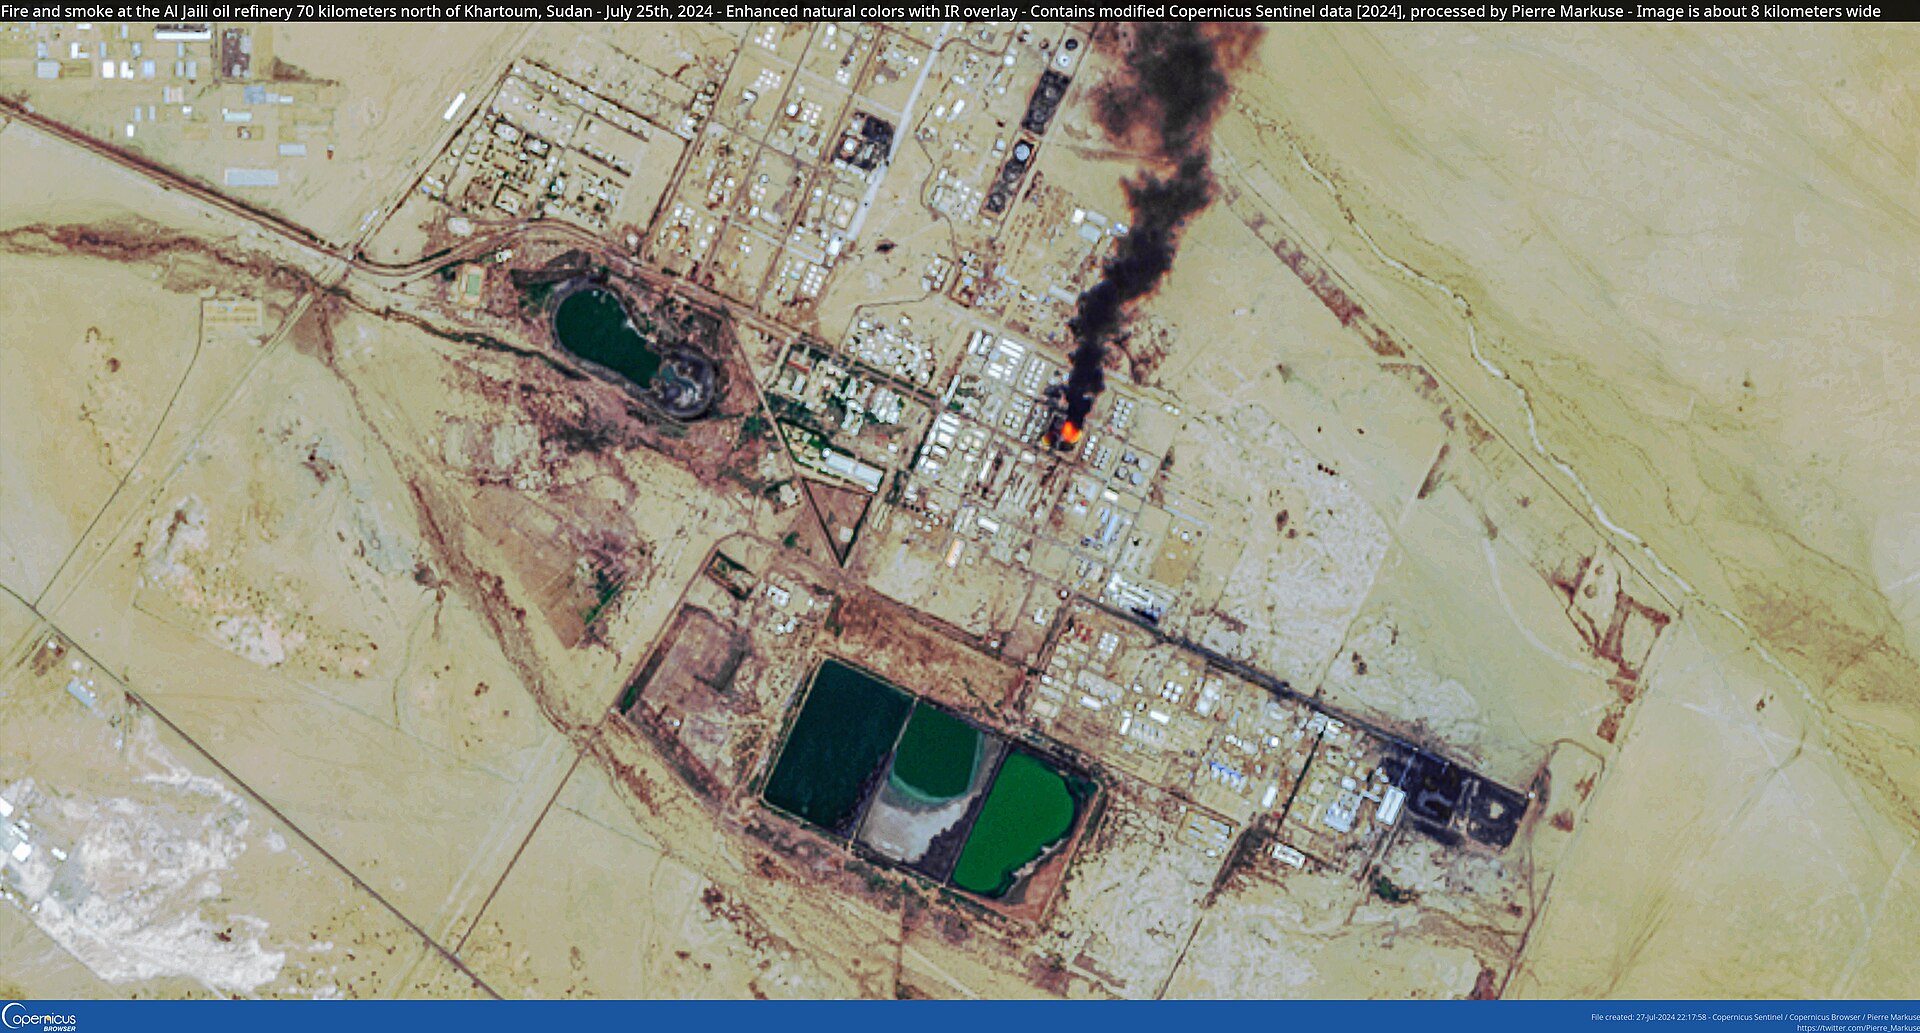
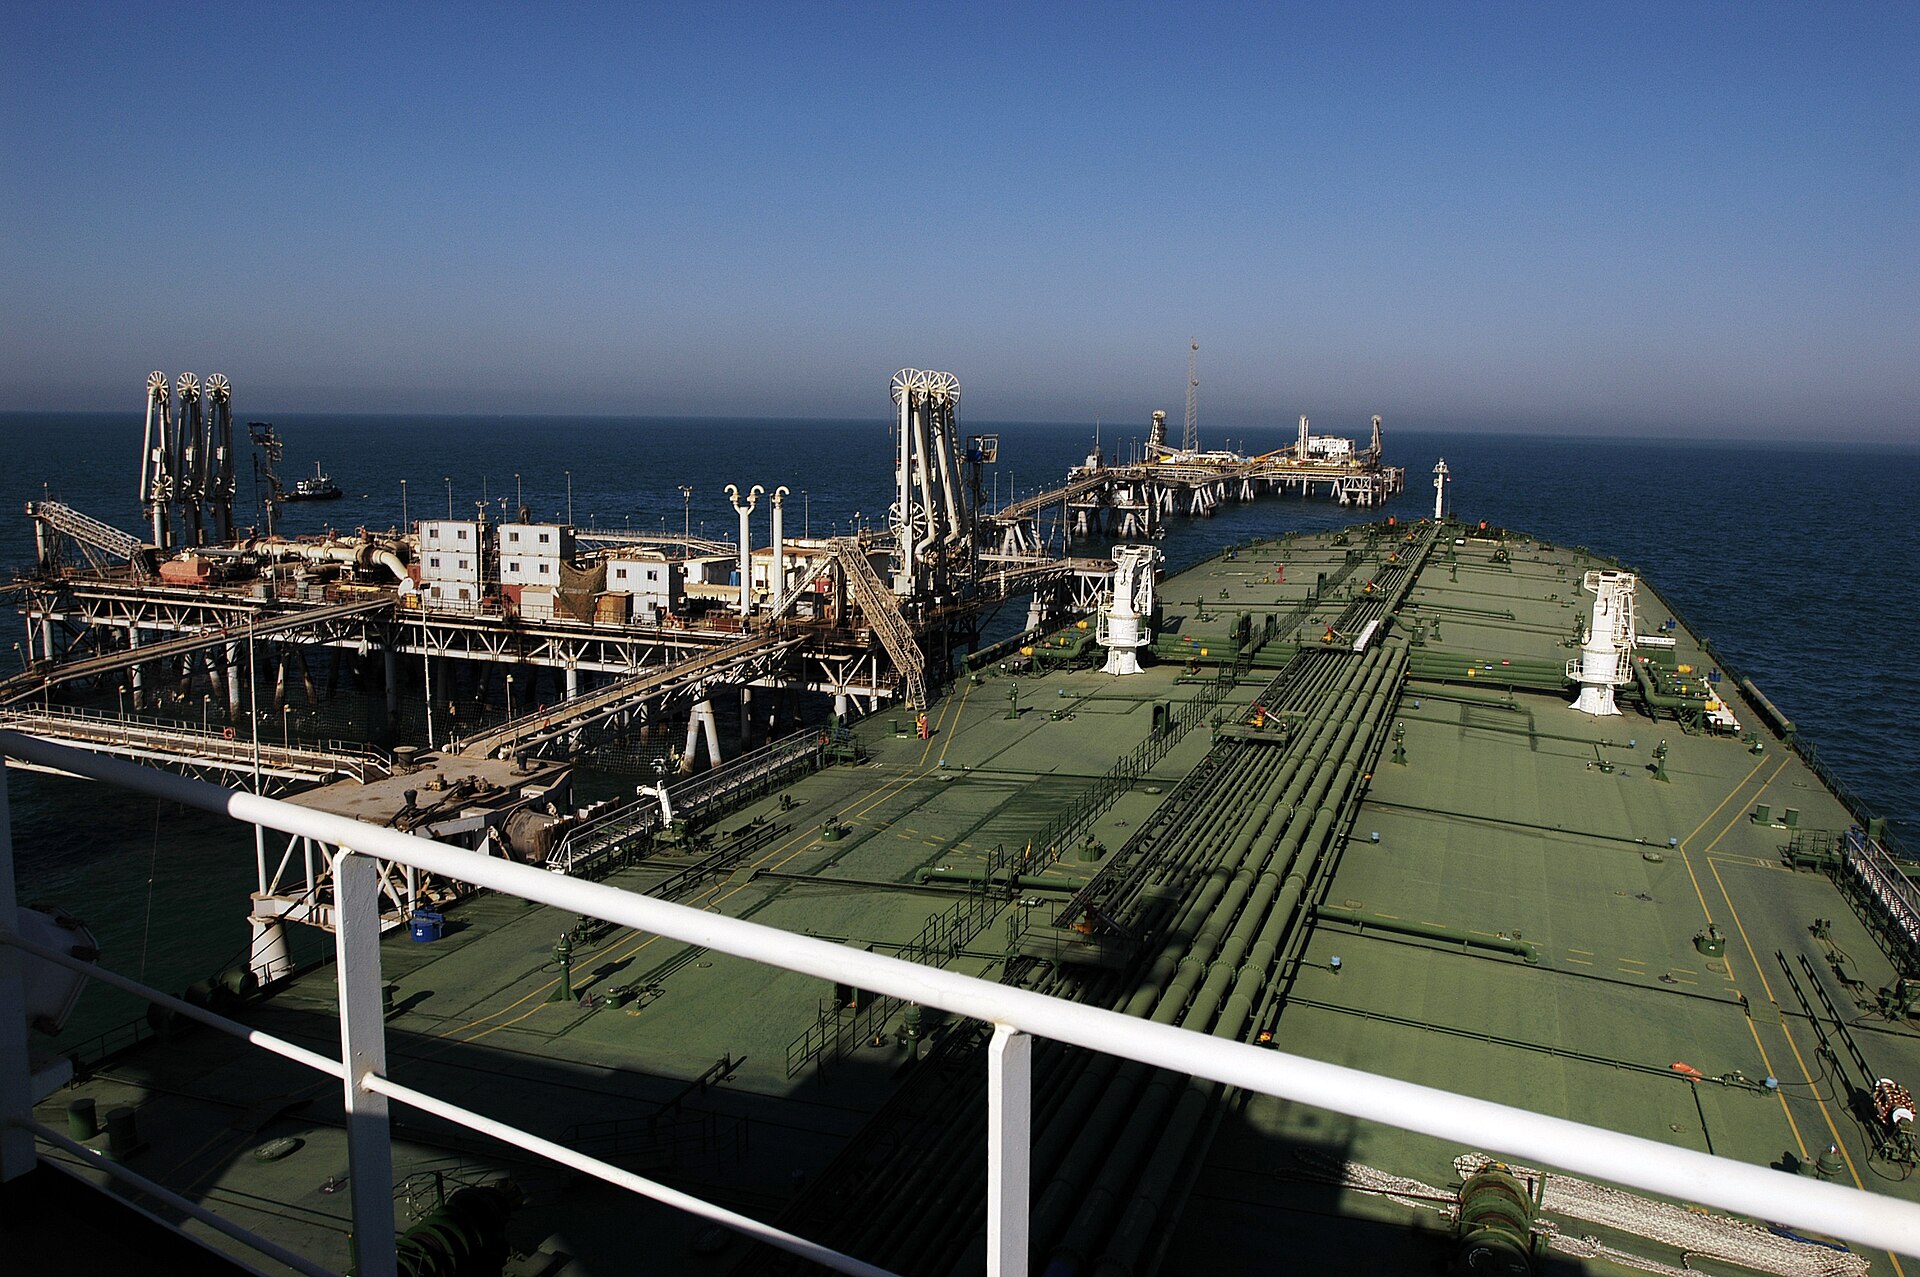
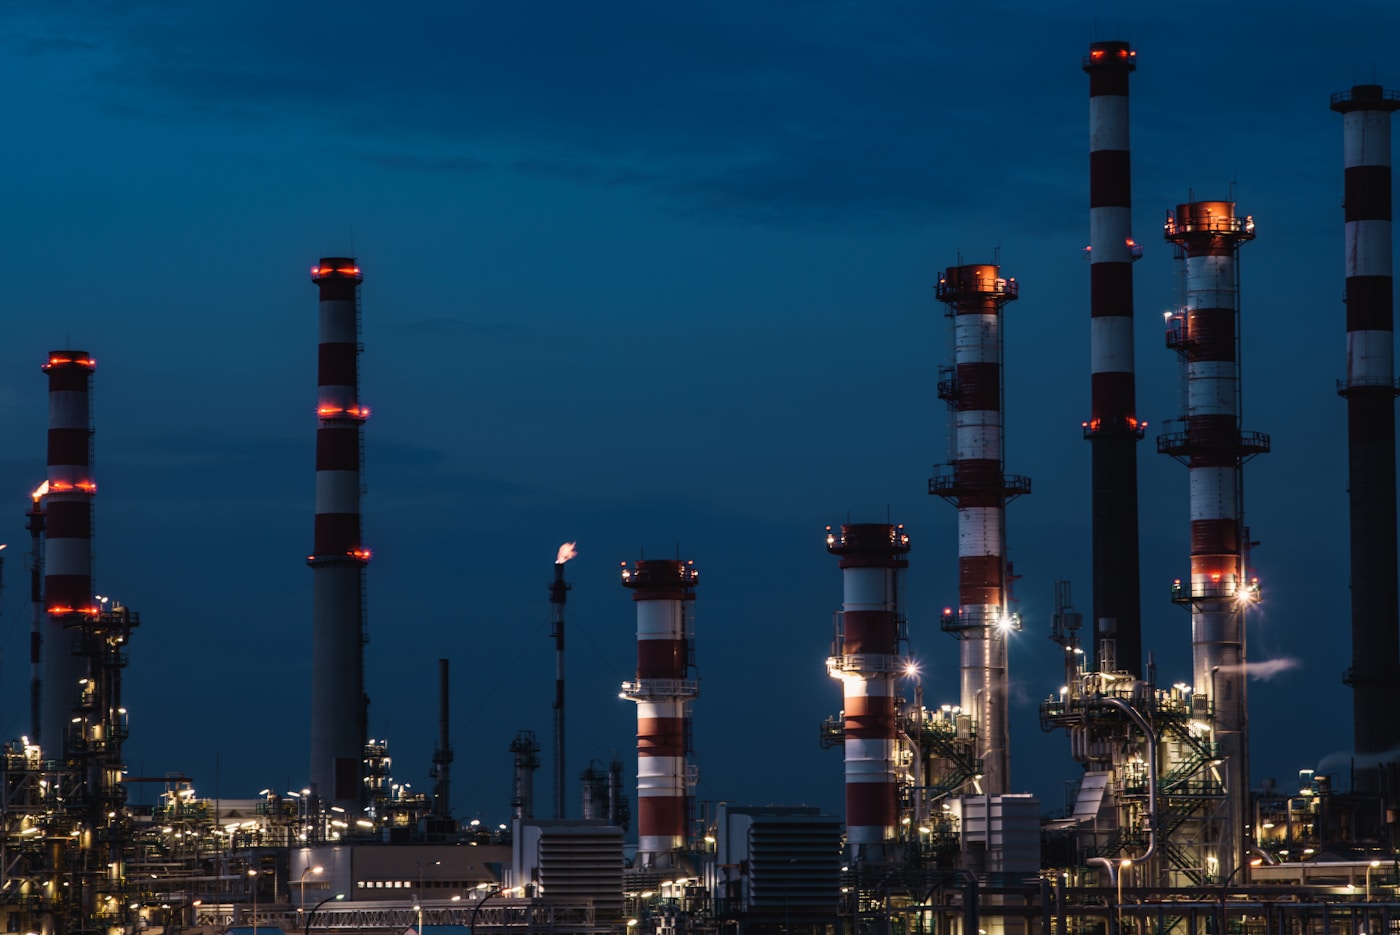
But circumstances are not normal. The Strait of Hormuz, through which roughly 80 percent of Saudi seaborne crude exports transit in peacetime, has been functionally closed to commercial shipping since Iranian mining operations and drone strikes forced insurers to withdraw coverage for Gulf-bound tankers in the first days of March. Saudi Arabia has rerouted what it can through the East-West pipeline to Yanbu on the Red Sea, but that pipeline’s maximum capacity is 5 million barrels per day, and it was already running near capacity before the war.
The net effect is devastating. Saudi oil output has been cut — not by choice but by logistics — to an estimated 4.5-5 million barrels per day that can actually reach market, according to Kpler commodity intelligence. At $90 per barrel, that yields roughly $405-450 million daily, compared to the $600 million-plus the Kingdom needs to cover its combined fiscal obligations. The shortfall — approximately $150-200 million per day, or $4.5-6 billion per month — must be covered either by drawing down reserves or by borrowing.
OPEC’s decision on March 1 to add 206,000 barrels per day of output starting in April, as reported by Bloomberg, was intended as a stabilising signal. In practice, it is meaningless for Gulf producers who cannot ship additional barrels through contested waters. The production increase benefits Russia — which shipped 3.26 million barrels per day in the four weeks to March 8 with no route disruptions, according to Bloomberg — more than it benefits Saudi Arabia or any other Gulf state.
“If oil cannot move through Hormuz, an extra 206,000 barrels per day does very little to ease the market. Prices will respond to developments in the Gulf and the status of shipping flows, not to a relatively small increase in output.”CNBC, reporting analyst commentary on OPEC+ decision, March 1, 2026
How the 2015 Oil Crash Nearly Broke the Peg
The closest historical parallel to the current pressure on SAMA’s balance sheet occurred between mid-2014 and early 2016, when oil prices collapsed from above $110 per barrel to below $30. During that 20-month period, SAMA burned through more than $150 billion in foreign reserves — a decline of roughly 20 percent — as the central bank bought riyals to maintain the 3.75 peg while government revenues cratered.
Forward currency markets briefly priced in a 2.7 percent devaluation, with 12-month riyal forwards trading at 3.85 to the dollar — the widest discount since the peg was established. SAMA responded aggressively, according to a Bloomberg analysis at the time, ordering Saudi banks to stop offering options contracts on riyal forwards to their institutional clients, effectively shutting down the market mechanism through which speculators could bet against the currency.
The parallels to 2026 are instructive but imperfect. In 2015, the threat was low prices — Saudi Arabia could sell as much oil as it wanted, but each barrel earned less. In 2026, the threat is low volumes — each barrel earns a premium, but far fewer barrels reach market. The 2015 crisis lasted 20 months and drained $150 billion. If the current export disruption persists at similar monthly rates, SAMA could face a comparable drawdown in under nine months. The difference is speed: the 2015 drain was gradual enough for Riyadh to implement austerity measures, raise domestic fuel prices, and issue international bonds. The 2026 drain is accelerating under wartime conditions that make bond issuance more expensive and austerity politically impossible.
Saudi Arabia’s public deficit reached 16 percent of GDP in 2015, according to a World Bank assessment. The 2026 budget projects a much smaller deficit of 3.3 percent of GDP — approximately SR165 billion ($44 billion) — based on pre-war revenue assumptions. Those assumptions are now obsolete. If Hormuz remains contested through the second quarter, the actual deficit could reach 8-12 percent of GDP, forcing Riyadh to choose between drawing reserves, borrowing at elevated wartime spreads, or cutting expenditure on the megaprojects that are supposed to wean the economy off oil dependence.
The Five Wartime Drains on SAMA’s Balance Sheet
The Iran war has opened five simultaneous channels of financial pressure on the Saudi central bank, each individually manageable but collectively unprecedented. Understanding these drains is essential to assessing whether the peg can hold.
Drain One — Lost Oil Revenue
As outlined above, the Hormuz disruption has reduced Saudi Arabia’s ability to monetise its oil reserves by an estimated 30-40 percent. At pre-war production levels and current prices, this represents a revenue shortfall of approximately $4.5-6 billion per month. The International Energy Agency’s record release of 400 million barrels from strategic petroleum reserves, announced on March 11, may moderate prices slightly but does nothing to reopen Saudi export routes.
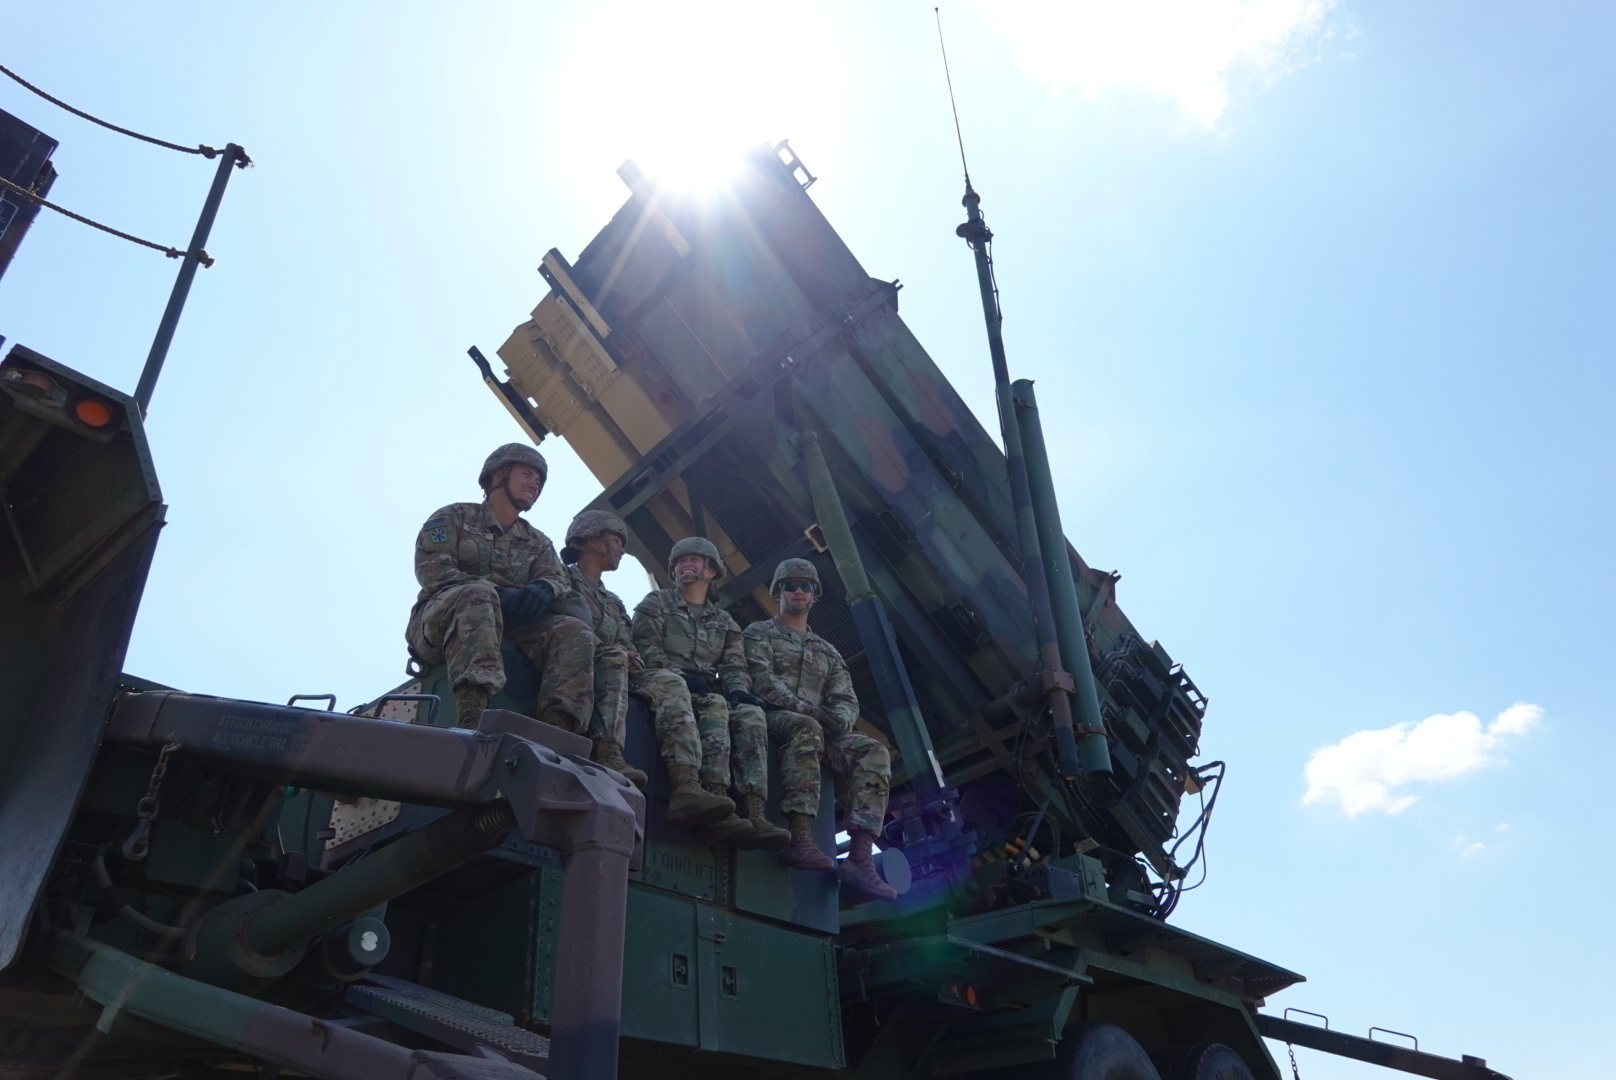
Drain Two — Defence Expenditure Spike
Saudi Arabia’s 2026 defence budget was set at approximately SR269 billion ($72 billion), already among the highest in the world relative to GDP. Wartime consumption of Patriot interceptor missiles — each costing $3-4 million — has been extraordinary. Saudi forces have intercepted dozens of ballistic missiles and hundreds of drones since March 1. At conservative estimates, interceptor expenditure alone has exceeded $1 billion in the first twelve days, and total additional defence costs including fuel, logistics, personnel mobilisation, and emergency procurement may reach $3-5 billion per month above baseline.
Drain Three — Import Price Inflation
Saudi Arabia imports roughly 80 percent of its food and a significant share of its manufactured goods. The Hormuz disruption and regional instability have driven shipping insurance premiums on Gulf-bound cargo to levels not seen since the Tanker War of the 1980s. Container shipping rates on the Asia-to-Gulf route have tripled, according to Freightos Baltic Index data. These costs are denominated in dollars and paid from SAMA’s reserves, adding an estimated $1-2 billion per month to the Kingdom’s import bill.
Drain Four — Capital Outflows
Bloomberg reported on March 2 that the Iran war had prompted an immediate rethink of the “stability premium” that Gulf financial centres had built their appeal on. Foreign portfolio investors — hedge funds, pension funds, and sovereign wealth funds with positions in the Tadawul (Saudi stock exchange) — have been reducing Gulf exposure. The Tadawul fell 12 percent in the first week of March, with net foreign outflows estimated at $8-10 billion according to exchange filings. Each dollar of foreign capital exiting the Tadawul must be converted from riyals to dollars, requiring SAMA to supply dollars and absorb riyals — a direct drain on reserves.
Drain Five — PIF Cash Calls
The Public Investment Fund, with $913 billion in assets under management, holds significant positions in global markets — including large stakes in U.S. tech companies, European luxury brands, and domestic megaprojects. Global equity markets have shed $6 trillion since the war began, according to a Semafor analysis, eroding PIF’s portfolio value. Meanwhile, PIF’s domestic obligations — ongoing construction at NEOM, The Line, the Red Sea Project, and dozens of giga-projects — require continued cash disbursements. If PIF faces margin calls on leveraged positions or needs to liquidate foreign assets to fund domestic commitments, those transactions flow through SAMA’s dollar reserves.
Is Saudi Arabia Spending Reserves Faster Than It Earns Them?
The arithmetic, at current run rates, is unfavourable. Combining the five drains above produces an estimated monthly net outflow from SAMA’s balance sheet of $12-18 billion — representing the gap between what Saudi Arabia earns from reduced oil exports and what it spends on imports, defence, capital flight compensation, and ongoing development.
At the lower bound of that range, SAMA’s $448 billion in reserves would last approximately 25-37 months. At the upper bound, the timeline shortens to 18-25 months. But these are linear projections that assume no acceleration — and currency crises rarely proceed linearly. As reserves fall below perceived thresholds, forward markets begin pricing in devaluation risk, which triggers additional capital flight, which accelerates the drain, which deepens the forward discount, in a reinforcing loop that currencies from the British pound in 1992 to the Thai baht in 1997 have failed to escape.
| Drain Category | Low Estimate (USD bn/month) | High Estimate (USD bn/month) |
|---|---|---|
| Lost oil revenue (vs. pre-war baseline) | $4.5 | $6.0 |
| Additional defence spending | $3.0 | $5.0 |
| Import cost inflation | $1.0 | $2.0 |
| Net capital outflows | $2.0 | $3.0 |
| PIF cash calls / domestic commitments | $1.5 | $2.0 |
| Total estimated monthly drain | $12.0 | $18.0 |
The critical threshold is psychological, not mathematical. Currency traders and institutional investors do not wait for reserves to reach zero before testing a peg. The 2015-2016 episode demonstrated that forward markets begin pricing devaluation risk when reserves fall below roughly $400 billion — the level at which Saudi Arabia’s reserve coverage drops below 12 months of imports. At current drain rates, that threshold could be breached by the third quarter of 2026 if the war continues.
The PIF Liquidity Trap — When a $913 Billion Fund Cannot Write Cheques
Saudi Arabia’s Public Investment Fund is the fifth-largest sovereign wealth fund on earth, with $913 billion in assets under management as of year-end 2024, according to PIF’s annual report. The fund holds stakes in companies ranging from Nintendo and Uber to Lucid Motors and the English Premier League’s Newcastle United. It is the financial engine of Vision 2030, responsible for creating 1.8 million jobs and channelling investment into the non-oil economy.
But assets under management are not the same as liquid assets. A significant portion of PIF’s portfolio is locked in illiquid investments: 40 percent of its capital is deployed domestically in real estate, infrastructure, and megaproject equity that cannot be sold on a public exchange. International positions in private equity, venture capital, and strategic stakes carry lock-up periods and contractual restrictions on disposal. Even PIF’s publicly traded holdings — its stakes in Saudi Telecom, ACWA Power, and dozens of Tadawul-listed companies — cannot be liquidated quickly without cratering the very market they dominate.
Semafor reported on March 9 that Gulf sovereign wealth funds collectively face “sharply different outcomes” from the conflict, with funds heavily weighted toward domestic and regional assets — PIF chief among them — facing the greatest stress. PIF’s domestic megaproject commitments require approximately $40-50 billion per year in capital disbursements, according to the fund’s five-year strategy document. These commitments do not pause for war. Construction crews at NEOM, Diriyah Gate, and King Salman Park continue pouring concrete and drawing down PIF cash balances while the fund’s international portfolio shrinks with global markets.
The structural irony is severe. PIF was created to reduce Saudi Arabia’s dependence on oil revenue. But in a crisis where oil revenue is disrupted, the fund becomes an additional drain on the financial system rather than a buffer. PIF draws on SAMA’s dollar reserves when it converts riyals to dollars for international investments. In a war economy, those same dollars are needed to defend the peg.
Gulf Capital in Flight — The $2 Trillion Rethink
Gulf sovereign wealth funds collectively hold over $2 trillion in U.S. assets — concentrated in real estate, technology companies, private equity, and U.S. Treasury bonds, according to an American Prospect analysis published March 11. Saudi Arabia’s PIF, the UAE’s Abu Dhabi Investment Authority, and Qatar Investment Authority are among the largest sovereign investors on the planet. Their capital underpins American infrastructure deals, Silicon Valley funding rounds, and, indirectly, U.S. government borrowing costs.
The war has catalysed an extraordinary reassessment of these positions. Asian Mail reported on March 6 that Saudi Arabia, the UAE, Kuwait, and Qatar had held discussions about withdrawing from U.S. contracts — a precautionary step in response to growing fiscal pressures including declining energy revenues due to shipping disruptions, losses in tourism and aviation, and a desire to retain capital for domestic defence and stabilisation needs.
For SAMA’s balance sheet, the capital flow dynamics are double-edged. If Gulf SWFs repatriate capital from the United States, those dollars flow back to the region and could theoretically bolster reserves. But the repatriation process itself creates market disruption — fire sales of U.S. assets depress prices, crystallise losses, and signal panic to global investors. And if the dollars are repatriated only to be spent domestically on wartime needs, they flow through SAMA’s balance sheet and out again as import payments, offering no lasting reserve accumulation.
Foreign Policy reported on March 4 that the Iran war’s spread to Dubai, Saudi Arabia, and Qatar was “jeopardising the entire global economy” by undermining the financial stability premium that had drawn trillions in foreign investment to Gulf states over the previous decade. That premium — the assumption that Gulf financial centres were safe, stable, and insulated from the region’s geopolitical volatility — evaporated in the first 72 hours of the conflict. Rebuilding it, once the missiles stop, may take years.
The Peg Pressure Index — Measuring What Markets Cannot See
Standard financial metrics — CDS spreads, forward exchange rates, reserve coverage ratios — capture individual dimensions of currency stress but fail to integrate the unique combination of pressures facing the Saudi riyal in wartime. A more comprehensive assessment requires weighing five factors simultaneously.
| Factor | Metric | Peacetime Norm | Current (March 2026) | Score (1-10) |
|---|---|---|---|---|
| Reserve Coverage | Months of imports covered by SAMA NFA | 18-24 months | ~13-16 months | 6 |
| Revenue Disruption | % of oil export revenue lost to Hormuz closure | 0% | 30-40% | 8 |
| Fiscal Gap | Monthly deficit above/below budget projections | On-budget | $4-6bn above | 7 |
| Capital Outflow | Net portfolio and FDI flows | Net inflow | Net outflow $8-10bn/month | 7 |
| Forward Market Discount | 12-month SAR forward vs. 3.75 peg | 3.7510-3.7530 | Estimated 3.78-3.82 | 5 |
The aggregate Peg Pressure Index stands at 33 out of a maximum 50 — elevated but not yet at crisis levels. For comparison, the index would have scored approximately 28-30 during the worst of the 2015-2016 oil crash and approximately 15-18 during the 2020 COVID period. A score above 40 would indicate acute devaluation risk; above 45, the peg would likely be untenable without external intervention such as a Fed swap line, IMF standby arrangement, or emergency bilateral lending from allied central banks.
The single most dangerous factor is revenue disruption (score: 8), because it directly undermines the mechanism through which SAMA replenishes reserves. Reserve coverage and capital outflows are the second-order effects. If Hormuz reopens — or if Saudi Arabia successfully reroutes sufficient export volume through Yanbu and Ras Tanura alternatives — the revenue disruption score drops rapidly, and the entire index improves. Conversely, if Iran escalates attacks on Oman’s Salalah Port (already struck on March 12, destroying the Gulf’s last Hormuz bypass) or targets Saudi pipeline infrastructure on the Red Sea coast, the revenue disruption score approaches 10 and the peg enters genuine danger.
What Happens If the Saudi Riyal Devalues?
A devaluation of the Saudi riyal — whether a managed one-off adjustment or, worse, an uncontrolled float — would trigger cascading consequences across the Saudi economy, the Gulf region, and global energy markets. The scenario is extreme but no longer unthinkable, and Riyadh’s policymakers are war-gaming it even as they publicly insist the peg is sacrosanct.
Domestically, a 10 percent devaluation (riyal moving from 3.75 to approximately 4.12 per dollar) would instantly raise the cost of every imported good by 10 percent. For a Kingdom that imports 80 percent of its food, this translates to an immediate food price shock affecting 36 million residents — including 13 million expatriate workers whose remittances, sent home in devalued riyals, would lose purchasing power overnight. Inflation, currently running at roughly 2.2 percent annually according to SAMA projections, could spike above 8-10 percent.
The real estate and construction sectors — the backbone of Vision 2030 — would face acute distress. Megaproject contracts are denominated in riyals but rely heavily on imported materials priced in dollars and euros. A devaluation would blow out cost estimates on projects already facing wartime supply chain disruptions. NEOM’s cost overruns, already significant before the war, could become uncontainable.
Sovereign debt markets would reprice Saudi risk aggressively. The Kingdom has approximately $80 billion in outstanding international bonds, according to Saudi Ministry of Finance data, much of it issued at investment-grade spreads during the pre-war period. A devaluation would raise the riyal-equivalent cost of servicing these dollar-denominated bonds, potentially tipping the fiscal balance from manageable deficit to debt-spiral territory. Standard and Poor’s current A+ rating with stable outlook, and Moody’s Aa3, would face immediate downgrade reviews.
Regionally, a Saudi devaluation would force other GCC states to reconsider their own dollar pegs. The UAE dirham, Qatari riyal, Bahraini dinar, and Omani rial are all pegged to the dollar through similar mechanisms. If the largest Gulf economy abandons the peg, market pressure on smaller economies would be intense. The GCC’s shared monetary architecture — which has facilitated cross-border trade, investment, and labour mobility for decades — could fracture.
Is the Tadawul a Barometer for the Riyal?
The Tadawul All Share Index — Saudi Arabia’s benchmark equity gauge — functions as a real-time referendum on investor confidence in the Kingdom’s financial stability. Its movements during the Iran war carry implications that extend well beyond the stock market and into the currency arena, because equity outflows and currency pressure are mechanically linked in a pegged economy.
The index fell 12 percent in the first week of March 2026, erasing approximately $300 billion in market capitalisation. Net foreign selling exceeded $8 billion, according to Tadawul exchange data, as international portfolio investors reduced Gulf exposure across the board. Domestic institutional investors — including PIF-affiliated entities — stepped in as buyers, partially cushioning the decline but depleting their own cash reserves in the process.
The linkage to the riyal is direct. When a foreign investor sells Saudi equities, the proceeds are in riyals. To repatriate capital, those riyals must be converted to dollars. SAMA provides those dollars from its reserves. Every $1 billion in foreign equity outflows thus becomes a $1 billion drain on SAMA’s balance sheet, independent of the oil revenue shortfall, defence spending, or any other channel. The Tadawul’s performance is therefore not merely an indicator of sentiment — it is a transmission mechanism for currency pressure.
Saudi Arabia’s credit default swap spreads — the market’s pricing of sovereign default risk — stood at 73.4 basis points as of February 5, 2026, before the war began. Post-war data has been sporadic, but analysts at JPMorgan estimated in a March 7 note that Saudi five-year CDS had widened to approximately 120-140 basis points, a significant deterioration from pre-war levels though still well within investment-grade territory. By comparison, Turkish CDS trade above 300 basis points, and Argentine CDS above 1,000.
The Tadawul’s partial recovery in the second week of March — regaining roughly 3 percent of the initial losses — suggests that the initial panic selling has stabilised. But a sustained recovery requires either a ceasefire or credible evidence that Saudi Arabia can maintain economic functionality during an extended conflict. Neither condition is yet met.
Saudi Arabia’s $100 Billion Debt Weapon
One of the most underappreciated tools in Riyadh’s arsenal is its borrowing capacity. Saudi Arabia’s government debt-to-GDP ratio stands at approximately 26 percent, according to Ministry of Finance data from the 2026 budget statement — a figure that places the Kingdom among the least indebted major economies on earth. Japan operates at 260 percent, the United States at 123 percent, and even fiscally conservative Germany at 64 percent.
This low starting point gives Saudi Arabia room to issue $50-100 billion in new sovereign bonds to bridge a temporary revenue shortfall without triggering market alarm. Pre-war, Saudi international bonds traded at yields of 4.5-5.5 percent — tight spreads reflecting the Kingdom’s A+ / Aa3 credit ratings. War premiums have widened those spreads by perhaps 100-150 basis points, but even at 6-7 percent yields, Saudi debt remains highly marketable to pension funds, insurance companies, and sovereign wealth funds seeking a combination of yield and credit quality.
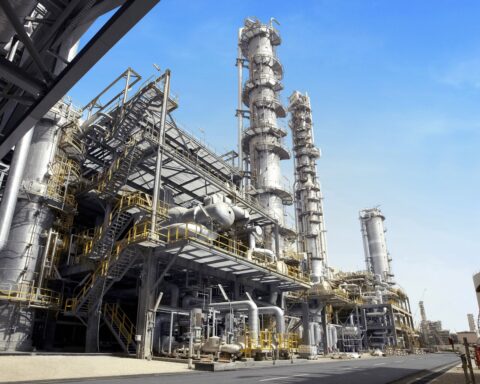
The 2026 budget already projected SR165 billion ($44 billion) in new borrowing. If war-driven revenue shortfalls double the financing need to $80-90 billion, this still leaves Saudi Arabia with a post-borrowing debt-to-GDP ratio of approximately 30-32 percent — comfortably below the 40 percent threshold that rating agencies typically view as a yellow flag for commodity-exporting economies. Aramco itself could supplement sovereign borrowing with corporate bond issuances; the company’s most recent quarterly report showed a base dividend of $21.89 billion for Q4 2025 alone, demonstrating cash generation capacity that supports investment-grade corporate debt even in wartime conditions.
The strategic question is timing. International bond markets are notoriously fickle during active military conflicts. Investor appetite for Gulf sovereign debt may be limited while missiles are still flying. The optimal window for emergency issuance would be immediately following a ceasefire — when risk premiums are still elevated enough to attract yield-hungry buyers but low enough to avoid punitive pricing. SAMA and the National Debt Management Centre are almost certainly preparing issuance documentation for this eventuality.
The Contrarian Case — Why the Peg Will Hold
The prevailing narrative in Western financial commentary — that the Iran war is pushing the Saudi riyal toward a crisis — misses several structural factors that work powerfully in SAMA’s favour. The peg is more likely to survive than markets currently price, for reasons that have little to do with conventional reserve adequacy metrics.
First, the war itself is generating windfall revenue on every barrel that does reach market. Saudi crude is selling at $90-110 per barrel compared to the $65-70 that the 2026 budget assumed. Even at reduced export volumes of 4.5-5 million barrels per day, the per-barrel windfall means that realised revenue is higher than what the budget projected at full volume and lower prices. The net fiscal impact is negative, but far less catastrophic than a scenario where prices and volumes both collapse — which was the 2015 situation.
Second, Saudi Arabia has a tool that was unavailable in 2015: the East-West pipeline system and Red Sea export infrastructure. Aramco’s emergency rerouting of exports through Yanbu is already delivering 3-4 million barrels per day to market via the Red Sea, bypassing Hormuz entirely. Capacity expansion of this route is underway and could add another 1-2 million barrels per day within months. The pipeline acts as a revenue backstop that SAMA did not have during the Gulf War.
Third, SAMA has an undisclosed but widely acknowledged line of communication with the U.S. Federal Reserve regarding emergency dollar liquidity. During the 2020 COVID crisis, the Fed extended dollar swap lines to 14 allied central banks to prevent dollar liquidity crunches from destabilising global currency markets. While SAMA was not among the original recipients, the current wartime alliance between Washington and Riyadh makes a Fed swap line — providing SAMA with direct access to dollar liquidity without drawing down reserves — a realistic backstop that markets may be underpricing.
Fourth, the political cost of devaluation is prohibitive. Mohammed bin Salman has staked his domestic legitimacy on economic transformation and rising living standards. A riyal devaluation would be the most tangible economic failure of his leadership, hitting every Saudi household through higher food and consumer prices. The Crown Prince would pay any financial cost to avoid it — including slashing Vision 2030 spending, issuing emergency bonds at unfavourable rates, or accepting bilateral loans from allied governments — before allowing the peg to break.
Fifth, Saudi Arabia’s overall debt-to-GDP ratio remains low by global standards — approximately 26 percent, according to Ministry of Finance data. This gives the government substantial borrowing capacity to bridge a temporary revenue shortfall. Even at elevated wartime spreads, Saudi Arabia can issue $50-100 billion in new international bonds before approaching debt levels that would concern rating agencies. The fiscal runway is measured in years, not months.
Does the Federal Reserve’s Dilemma Help or Hurt Saudi Arabia?
The U.S. Federal Reserve meets on March 17-18 to set interest rates in an economic environment that the Iran war has made profoundly uncertain. The Fed’s benchmark rate stands at 4.25-4.50 percent following three cuts in the second half of 2025. Markets had been pricing in four additional cuts totaling 100 basis points through the end of 2026, which would bring rates to approximately 3.25-3.50 percent.
The war complicates every dimension of the Fed’s decision. Higher oil prices feed into U.S. inflation, which argues against cutting. But the economic uncertainty generated by a major Middle Eastern war argues for caution, and potentially for rate cuts to buffer against a slowdown. The economy is caught between inflationary supply shocks and deflationary demand destruction — a stagflation scenario that monetary policy is poorly equipped to address.
For SAMA, the Fed’s dilemma creates a narrow but meaningful advantage. If the Fed holds rates steady or cuts, SAMA can follow with parallel moves that reduce the domestic cost of borrowing in Saudi Arabia, easing fiscal pressure on the government and reducing the carrying cost of the Kingdom’s bond portfolio. Lower U.S. rates also reduce the yield advantage of holding dollars over riyals, diminishing one driver of capital outflows. Saudi Arabia’s SAMA repo rate currently sits at 4.25 percent, mirroring the Fed, and projections from Economy Middle East anticipated a decline to 4.35 percent on the 3M SAIBOR benchmark by year-end.
A scenario where the Fed unexpectedly raises rates — responding to war-driven inflation with tightening — would be the worst case for the riyal. Higher U.S. rates would widen the yield differential, incentivise capital flight from Saudi assets, force SAMA to tighten into a war-weakened economy, and drain reserves faster as the cost of defending the peg rises. This scenario is unlikely but not impossible if oil prices spike above $130 and U.S. headline inflation surges past 5 percent.
Frequently Asked Questions
Will the Saudi riyal be devalued because of the Iran war?
Devaluation remains unlikely in the near term. SAMA holds approximately $448 billion in reserves, Saudi Arabia’s debt-to-GDP ratio is a manageable 26 percent, and the political commitment to the peg is absolute. However, if the Hormuz disruption persists beyond six months and Saudi oil exports cannot be rerouted in sufficient volume, reserve depletion could reach levels that force market-driven adjustment. The Peg Pressure Index stands at 33 out of 50 — elevated but below the 40+ crisis threshold. A potentially greater long-term threat comes from Iran’s reported willingness to condition Hormuz passage on yuan-denominated trade, which would erode the dollar-revenue foundation on which the peg depends.
How much does it cost Saudi Arabia to defend the riyal peg each month during the war?
The estimated monthly net drain on SAMA’s foreign reserves ranges from $12-18 billion, driven by lost oil revenue ($4.5-6 billion), additional defence spending ($3-5 billion), import cost inflation ($1-2 billion), capital outflows ($2-3 billion), and PIF cash calls ($1.5-2 billion). At these rates, SAMA’s $448 billion reserve buffer provides 25-37 months of coverage before approaching critical thresholds.
What happened to Saudi reserves during the 2015 oil crash?
Between January 2015 and early 2016, SAMA’s foreign reserves fell from approximately $737 billion to $587 billion — a decline of $150 billion, or 20 percent, over 20 months. Forward currency markets briefly priced a 2.7 percent devaluation, and SAMA ordered Saudi banks to stop offering riyal forward options contracts to suppress speculative activity. The peg held, but the episode consumed roughly one-fifth of Saudi Arabia’s financial reserves.
Could the Federal Reserve help Saudi Arabia defend the riyal?
Yes. The Fed maintains dollar swap lines with allied central banks to provide emergency dollar liquidity during crises. During the COVID-19 pandemic, the Fed extended swap facilities to 14 central banks. While SAMA was not included in 2020, the current U.S.-Saudi wartime alliance makes a swap line arrangement feasible. Such a facility would give SAMA access to dollars without depleting reserves, significantly reducing peg pressure.
What would a riyal devaluation mean for Saudi Arabia’s Vision 2030 megaprojects?
A 10 percent devaluation would raise the riyal-denominated cost of every imported material — steel, glass, machinery, engineering services — by a corresponding amount. For megaprojects already facing wartime supply chain disruptions and cost overruns, this could add $30-50 billion in aggregate costs across the Vision 2030 portfolio. NEOM, The Line, Diriyah Gate, and the Red Sea Project would all require revised budgets, potentially forcing the postponement or scaling back of elements that the Crown Prince has presented as non-negotiable.
How does Saudi Arabia’s situation compare to other currency peg crises in history?
The closest comparators are the British pound’s ejection from the European Exchange Rate Mechanism in 1992 (the “Black Wednesday” crisis), the Thai baht’s collapse that triggered the 1997 Asian financial crisis, and the Argentine peso’s devaluation in 2002. In each case, reserves proved insufficient to defend a fixed rate against sustained speculative pressure once markets concluded the fundamentals no longer supported the peg. Saudi Arabia’s position is stronger than these precedents — higher reserves relative to GDP, lower government debt, and a commodity export base that generates structural dollar inflows — but the wartime disruption to those inflows is the variable that makes historical comparisons uncertain.
The dollar peg pressure arrives alongside a broader financial services crisis. International banks are evacuating Gulf offices after Iran declared financial institutions military targets, potentially redirecting capital flows toward Riyadh and Saudi Arabia’s King Abdullah Financial District as the region’s safest financial hub.
The pressure on the riyal-dollar peg has intensified since Iran expanded its target set to include financial institutions. Tehran’s parliament speaker declared Treasury bondholders legitimate targets in a move that analysts describe as the most significant escalation of financial warfare since the Hormuz closure.