
DHAHRAN — Goldman Sachs published a Q2 Brent forecast of $90 per barrel on April 8, cut from $99, on the strength of a single precondition: that LNG flows through the Strait of Hormuz would begin normalising from mid-April. Within hours of publication, Day 2 ceasefire data from the strait recorded seven ships in twenty-four hours — zero of them oil tankers — before Iran suspended traffic again, citing Israeli strikes on Lebanon. The assumption that underwrites Goldman’s number did not survive its first full news cycle.
The $90 call is not analytically wrong about the price mechanics. It is wrong about the physical precondition on which the price mechanics depend. Goldman’s own recovery curve requires flows at five per cent of normal for six weeks, followed by a thirty-day ramp. Day 2 throughput ran at roughly six per cent of pre-war levels, then dropped to zero.
Wood Mackenzie estimates that even a May 1 restart of Qatar’s Ras Laffan LNG complex would not restore full production until late August — three to four months after Goldman’s mid-April normalisation date. The forecast is not a ceiling. It is a floor beneath which only a full Hormuz reopening could push prices. And that reopening is not underway.
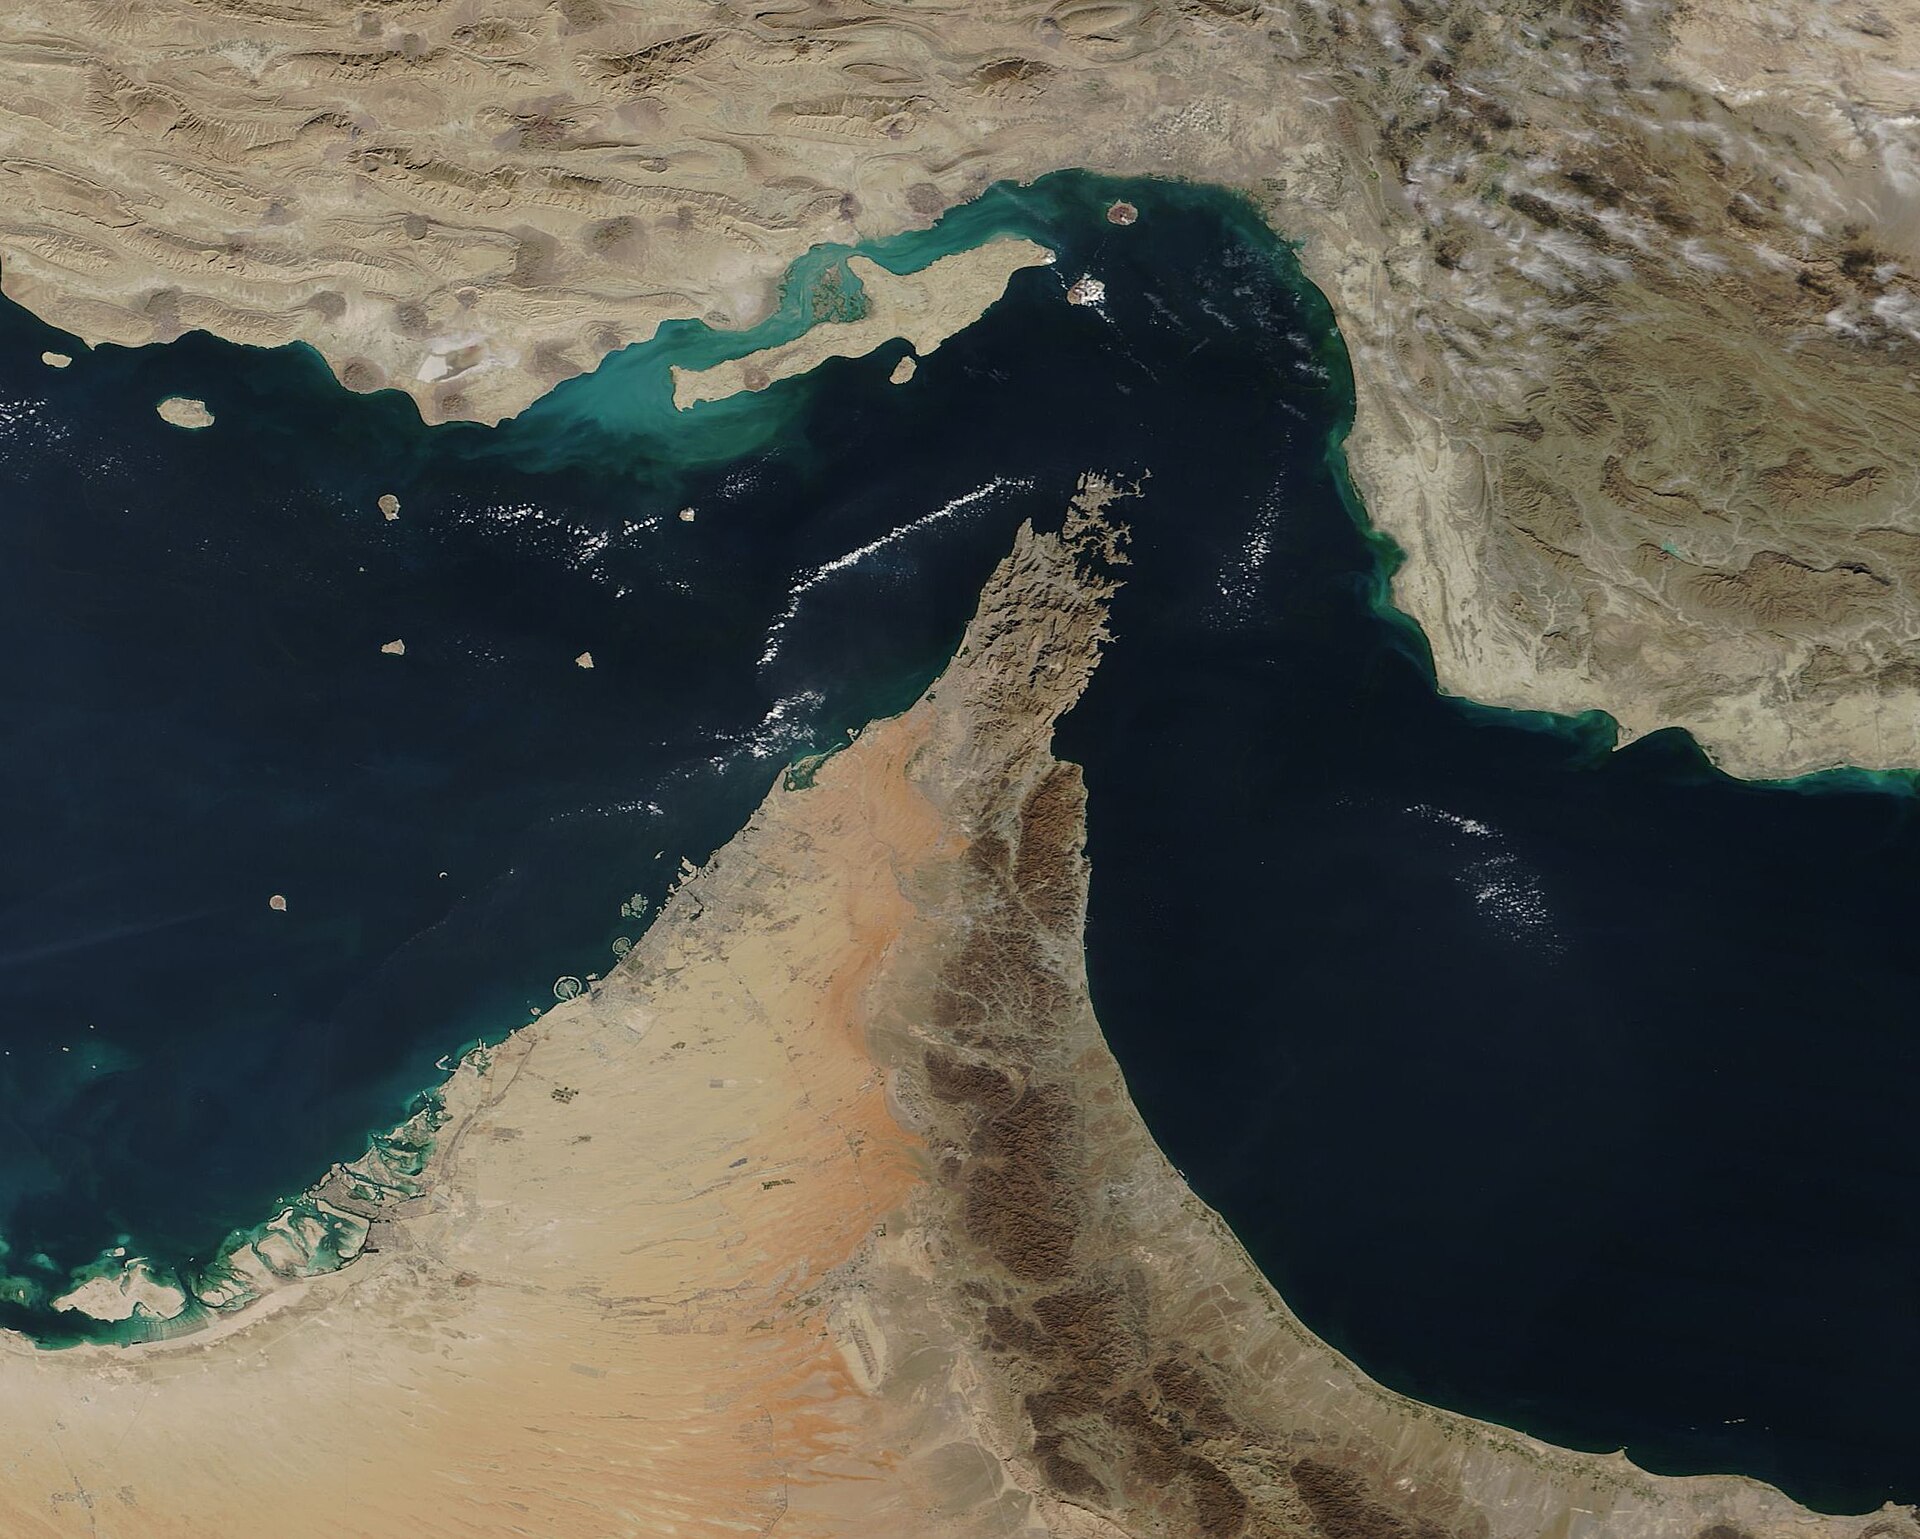
Table of Contents
- Goldman’s Forecast Architecture: The LNG Pillar
- What Did Hormuz Day 2 Actually Show?
- Why Is Mid-April LNG Normalisation Physically Impossible?
- Iran’s Toll System and the Coordination Doctrine
- The Physical-Futures Price Divergence
- What Happens to Goldman’s Own Forecast When the LNG Assumption Fails?
- Saudi Arabia’s June OSP Repricing Trap
- The Shipping Repositioning Lag Nobody Is Modelling
- War Risk Insurance and the Cost of a Single Transit
- Frequently Asked Questions
Goldman’s Forecast Architecture: The LNG Pillar
Goldman’s April 8 note cut the Q2 2026 Brent forecast to $90 per barrel from $99, and WTI to $87 from $91, citing the US-Iran two-week ceasefire. The adjustment, in Goldman’s own language, “reflects a reduction in the risk premium and improving oil flows through the Strait of Hormuz.” Simultaneously, Goldman cut its Q2 TTF European gas benchmark forecast to 50 EUR/MWh from 70 EUR/MWh — on the same mid-April LNG normalisation assumption.
The LNG assumption is structurally decisive because it sets the European energy price anchor. If LNG flows from Qatar resume on Goldman’s timeline, European gas costs stabilise, gas-to-oil switching dynamics ease, and crude demand moderates — producing the $90 number. If LNG normalisation fails, the cascade runs in reverse: TTF breaches 75 EUR/MWh, European utilities compete more aggressively for remaining crude-linked energy supply, and oil demand holds at war-era levels.
Goldman’s own conditional language on the gas side acknowledged the vulnerability: “If LNG flows are significantly delayed or production infrastructure is damaged, prices will likely go above 75 EUR/MWh.” That conditional has already been triggered. Two of Qatar’s LNG trains — S4 and S6, totalling 12.8 million tonnes per annum — were destroyed and are offline for three to five years per QatarEnergy’s CEO. The remaining trains have been shuttered since March 2, with force majeure declared March 4, removing approximately 80 MTPA from the market — roughly nineteen per cent of global LNG supply.
The Middle East briefing 3,000+ readers start their day with.
One email. Every weekday morning. Free.
Goldman’s base case oil recovery curve assumes flows through Hormuz hold at five per cent of normal for six weeks, then ramp over thirty days to pre-war throughput. The bank’s prior forecast trajectory moved in the opposite direction: on March 22, Goldman lifted its 2026 average Brent call to $85 from $77, with commodity strategist Daan Struyven calling the Hormuz disruption “the largest-ever oil supply shock,” exceeding the 1973 OPEC embargo. The April 8 cut to $90 Q2 prices in the ceasefire. It does not price in the ceasefire failing.
What Did Hormuz Day 2 Actually Show?
Day 2 of the ceasefire showed that Hormuz is not reopening on Goldman’s timeline. Over the twenty-four hours of April 9, seven ships transited the strait. Not one was an oil tanker. Pre-war throughput ran at 100 to 120 commercial vessels per day, according to Kpler — making Day 2’s count roughly six per cent of normal volume.
This was worse than Day 1. On the first day of the ceasefire, approximately fifteen ships passed through, including two laden tankers that had been trapped for weeks. The trajectory is not improving; it is deteriorating. Iran suspended tanker traffic through Hormuz on the same day Goldman published its forecast, after Israel launched strikes on Lebanon. Fars News stated traffic was being “suspended” over Israel’s continuing attacks — confirming that Iran does not treat the Hormuz ceasefire as separable from the Lebanon front, as documented here.
The chances of a meaningful reopening any time soon look dim.
Vandana Hari, founder, Vanda Insights, April 9, 2026
Iran told mediators it would limit transits to approximately a dozen per day during the ceasefire even under optimal conditions, according to the Wall Street Journal — under ten per cent of pre-war throughput. Kpler analyst Matt Smith estimated “we may just see 10-15 given that Iran is still vetting who goes through: that would be a similar pace to that seen in recent days.” Neither figure is compatible with Goldman’s normalisation curve.
Why Is Mid-April LNG Normalisation Physically Impossible?
Goldman’s mid-April LNG normalisation assumption requires four conditions to hold simultaneously: the ceasefire must survive its full fourteen-day term, Iran must permit LNG tankers through the strait, fourteen stranded laden LNG cargoes trapped inside the Gulf must transit safely, and Qatar must begin restarting Ras Laffan immediately. None of these conditions was met as of April 9.
Wood Mackenzie’s assessment is unambiguous: even if QatarEnergy began restarting Ras Laffan at the start of May, it would take until the end of August for all twelve trains to return to full service. Qatar mobilised engineers to begin restart preparations on April 8, but Wood Mackenzie noted it is unclear whether QatarEnergy would commit to a restart during a two-week ceasefire. The commercial logic is straightforward: restarting an LNG train costs tens of millions of dollars and takes weeks per unit; shutting one down again if the ceasefire collapses on April 22 is an uninsurable loss.
The “mid-April” assumption is therefore three to four months ahead of Wood Mackenzie’s base case for full production recovery. Even a partial recovery — four or five trains operating — requires stable Hormuz transit for several consecutive weeks, which Iran’s own stated policy of twelve ships per day cannot deliver. Fourteen laden LNG cargoes remain trapped in the Gulf. Nineteen LNG carriers sit among the 800 vessels trapped inside the Persian Gulf.
Wood Mackenzie summarised the broader picture: “Middle East oil and gas recovery faces months-long process despite ceasefire.” Goldman’s model assumes weeks.
Iran’s Toll System and the Coordination Doctrine
Goldman’s normalisation assumption implicitly requires Iran to relinquish operational control over Hormuz transit. Iran’s actions since the ceasefire began indicate the opposite trajectory. The $1-per-barrel crypto toll system codified in Iran’s “Strait of Hormuz Management Plan,” approved March 30-31, remains operative. Iran’s Oil, Gas, and Petrochemical Products Exporters’ Union confirmed ships must pay in bitcoin or Chinese yuan through Kunlun Bank.
The White House stated the ceasefire depends on Hormuz opening “without limitation, including tolls.” But as an unnamed shipping executive told CNBC from the Persian Gulf: “We have no information about how we could transit the Strait of Hormuz during the ceasefire. We are not in contact with the Iranian authorities.” The gap between Washington’s stated condition and the operational reality in the strait is the gap Goldman’s forecast does not account for.
Iran’s 10-point plan, Point 7, requires IRGC “coordination” over Hormuz as a treaty requirement — a condition analysed in detail alongside the IRGC mine chart and the Hormuz traffic separation scheme danger zone declaration. “Normalisation” as Goldman defines it requires Iran to concede sovereign operational control over the strait. That is not a ceasefire-level concession. It is a final-status negotiating outcome that does not appear in any draft currently under discussion.
The IRGC treats the gas lane asymmetrically from the crude lane. The two Qatari LNG tankers — Al Daayen and Rasheeda — that attempted transit on Day 1 did so through Chinese intermediation, not through any Iranian-American ceasefire protocol. Al Daayen completed its transit at 8.8 knots toward China. Rasheeda pulled back. The gas lane is not normalising. It is operating on a ship-by-ship basis through Beijing’s good offices, which is a categorically different mechanism from what Goldman’s model requires.
The Physical-Futures Price Divergence
The physical oil market has already priced in the failure of Goldman’s assumption — even if the futures market has not. On April 8, dated Brent spot (physical cargo delivery) remained above $120 per barrel while futures crashed below $100. That $20-plus spread between physical and paper barrels is the market’s real-time verdict on the ceasefire’s ability to move actual crude.
By April 9, Brent futures had rebounded to approximately $97-98 per barrel as Iran accused the United States of three ceasefire violations and oil tanker traffic remained frozen. The futures bounce erased roughly half of Goldman’s implied discount within twenty-four hours of the forecast’s publication.
Goldman’s own prior analysis described the Hormuz disruption as threatening “nearly 20% of world oil supply” — compared with seven per cent in the 1973 embargo, which removed 4.5 million barrels per day. The current closure is stopping approximately 20 million bpd. Struyven’s characterisation of it as “the largest-ever oil supply shock” remains operationally accurate. The ceasefire has not changed the physical constraint; it has changed the narrative around the physical constraint.
The physical-futures divergence is the market’s way of saying what Goldman’s model does not: that the bottleneck is not price but tonnage. There are not enough ships in the right places, moving through the right waters, with the right insurance, to convert a $90 futures price into $90 worth of delivered crude. The dated Brent premium above $120 reflects the scarcity rent on barrels that can actually reach a refinery within the loading window. Until that scarcity eases — which requires weeks of sustained Hormuz throughput, not a two-week ceasefire announcement — the physical market will continue to trade at a structural premium to the paper market Goldman is forecasting.
What Happens to Goldman’s Own Forecast When the LNG Assumption Fails?
Goldman answered this question itself. The bank’s downside scenario, published alongside the $90 base case, states that if the ceasefire does not hold and Middle East production losses persist at approximately 2 million barrels per day, Brent could average closer to $115 in Q4 2026. Goldman separately flagged Brent above $100 if Hormuz remains closed for another month.
The LNG dimension compounds the oil forecast. Goldman’s own conditional trigger — TTF above 75 EUR/MWh if LNG flows are “significantly delayed” — activates a cross-commodity feedback loop. European utilities burning more oil and coal to compensate for absent LNG push crude demand higher, which tightens the very market Goldman is forecasting at $90. If that assumption fails, TTF reverts to 75 EUR/MWh or higher by Goldman’s own model — and the $90 crude call loses its demand-side anchor.
The arithmetic is sequential: LNG does not normalise, TTF exceeds 75 EUR/MWh, gas-to-oil switching holds, crude demand stays elevated, and $90 becomes a floor rather than a central estimate. Goldman’s Q3 base case of $82 and Q4 of $80 require the recovery curve to execute on schedule. Day 2 data shows no evidence of that schedule holding.
| Goldman Scenario | Brent Q2 2026 | Brent Q4 2026 | Key Assumption | Day 2 Status |
|---|---|---|---|---|
| Base case | $90/bbl | $80/bbl | LNG normalisation mid-April; 5% flows for 6 weeks then 30-day ramp | 7 ships, zero oil tankers, traffic suspended |
| Downside (ceasefire fails) | — | $115/bbl | 2M bpd persistent losses | Iran accused US of 3 violations in 24 hours |
| Extended closure (+1 month) | >$100/bbl | — | Hormuz closed through mid-May | Iran limiting transits to ~12/day; toll system operative |
Saudi Arabia’s June OSP Repricing Trap
Goldman’s $90 forecast intersects directly with Saudi Arabia’s most pressing commercial decision: the June Official Selling Price, which Aramco must announce approximately May 5. The May OSP was set at +$19.50 per barrel above the Oman/Dubai average when Brent traded near $109 on April 6. With Brent at $97 on April 9, the May OSP already sits $11-14 per barrel above spot — an inversion that penalises every Asian buyer lifting Saudi crude under term contract.
If Goldman’s $90 materialises by May 5, the inversion expands to the full $19.50. Aramco would then face a choice between correcting the June OSP downward by an unprecedented magnitude — the largest single-month OSP cut in recent memory, against a December 2024 precedent of just $2 per barrel — or allowing two consecutive months of inversions that give Asian buyers a commercial incentive to lift spot cargoes instead of term barrels.
The OSP repricing window opens before Goldman’s own revised reality can reach Asian buyer desks. Goldman’s forecast assumes a gradual price decline through Q2 as Hormuz normalises. Aramco’s pricing decision cannot wait for that normalisation to confirm. The June OSP must be set on approximately May 5 based on conditions as they exist in late April — when, by Goldman’s own recovery curve, flows should still be at five per cent of normal. Aramco is pricing into a market Goldman says will improve but cannot yet demonstrate is improving.
The original $19.50 premium was set against Bloomberg survey expectations of $40 per barrel — a $20.50 gap that reflected Aramco’s view that the term contract structure insulates it from spot volatility. That insulation holds only as long as buyers cannot find cheaper alternatives. India’s refiners — IOC, BPCL, HPCL — already face a $6 to $6.50 per barrel discount on spot markets relative to Saudi term pricing.
The Shipping Repositioning Lag Nobody Is Modelling
Even if Hormuz opened fully tomorrow, the supply recovery would not be instantaneous. Helima Croft of RBC Capital Markets estimated the shipping recovery could take as long as five months to restore capacity, with tanker repositioning alone requiring until June — merely to redirect vessels back to the Middle East from their current locations.
The lion’s share of OPEC barrels in the region could essentially become stranded assets in an extended war scenario.
Helima Croft, head of global commodity strategy, RBC Capital Markets
More than seventy empty VLCCs idle off Singapore, each requiring a four-week voyage to reach the Gulf. The 800 vessels trapped inside the Persian Gulf include 426 tankers that cannot exit, and new tankers cannot enter to replace them. The East-West Pipeline to Yanbu provides bypass capacity of 3-4 million barrels per day effective throughput against a 7 million bpd nameplate — but Yanbu itself was struck on April 3 and the pipeline’s pumping station was hit on April 8, the day the ceasefire nominally began.
Goldman’s thirty-day ramp from five per cent to normal throughput requires not just Hormuz opening but tanker availability, crew willingness, insurance coverage, and port readiness at both loading and discharge terminals. None of these secondary conditions tracks to a thirty-day recovery. Croft’s five-month estimate and Goldman’s one-month ramp differ by a factor of five.
The repositioning lag operates on a different timescale from price signals. A VLCC owner who sees Brent at $90 and decides to send a vessel toward the Gulf must wait four weeks for the ship to arrive from Southeast Asia, secure war-risk cover at $10-14 million per voyage, confirm that Hormuz is still open upon arrival, and load cargo at a terminal that may have sustained damage. The decision cycle from price signal to delivered barrel is measured in months, not the weeks Goldman’s recovery curve assumes.
War Risk Insurance and the Cost of a Single Transit
War risk insurance premiums for a single Hormuz voyage now run $10 to $14 million per trip, according to Lloyd’s List. Hull war cover for Gulf-bound vessels has risen to as much as one per cent of vessel value per seven days — quadruple the 0.25 per cent rate prevailing before the war. For a modern VLCC valued at $120-150 million, that translates to $1.2-1.5 million per week in hull cover alone, on top of the voyage premium.
These costs do not decline when a ceasefire is announced. They decline when underwriters observe sustained safe passage over weeks or months — a lag that tracks to the physical reality of the strait, not to the diplomatic reality of a two-week agreement. Goldman’s normalisation curve implicitly assumes insurance costs revert on the same timeline as physical flows. Lloyd’s syndicates operate on a different calendar.
Add Iran’s $1-per-barrel toll — approximately $2 million per laden VLCC — and the total cost of a single Hormuz transit during the ceasefire period exceeds $12-16 million. At pre-war throughput of 100-plus vessels per day, the aggregate daily toll revenue to Iran would approach $276 million at the $1-per-barrel rate. Goldman’s model does not incorporate toll costs, insurance premiums, or the behavioural impact of those costs on shipping decisions.
| Cost Component | Per Voyage / Per Week | Source |
|---|---|---|
| War risk insurance premium | $10-14M per trip | Lloyd’s List |
| Hull war cover | Up to 1% of vessel value / 7 days | Lloyd’s List |
| Iran toll (laden VLCC, $1/bbl) | ~$2M per voyage | FT / IranWire |
| Total estimated transit cost | $12-16M per voyage | Composite |
| Pre-war hull war cover | 0.25% of vessel value / 7 days | Lloyd’s List |
Frequently Asked Questions
How does Goldman’s $90 Brent forecast compare with other bank estimates for Q2 2026?
Goldman’s $90 sits at the lower end of post-ceasefire Wall Street estimates. The $90 figure represents a $9 cut from Goldman’s own pre-ceasefire Q2 call of $99, and rests on the most optimistic Hormuz recovery timeline among major commodity desks. RBC Capital Markets, by contrast, has emphasised the five-month shipping recovery timeline, and Wood Mackenzie’s LNG restart estimate extends into late August — both of which imply Q2 prices above Goldman’s central case. Goldman itself flags Brent above $100 if Hormuz stays closed another month and $115 in Q4 under its severe scenario.
What is the practical difference between a ceasefire and Hormuz reopening?
The ceasefire is a bilateral diplomatic agreement between the United States and Iran, mediated through Pakistan, covering military operations. Hormuz reopening requires a separate operational protocol governing ship-by-ship transit, Iranian naval coordination, mine clearance (the US Navy retired its four Avenger-class mine countermeasure ships from Bahrain in September 2025), insurance market repricing, and crew willingness to sail. The ceasefire is a political event; Hormuz reopening is a logistical, legal, and commercial process. Goldman’s forecast treats them as synchronous. They are sequential, with months of lag between the first and the second.
Could Goldman revise the $90 forecast before the June OSP decision on May 5?
Goldman typically updates commodity forecasts on an ad hoc basis when assumptions are invalidated by events, rather than on a fixed schedule. The bank revised its Brent outlook three times between March and April 2026 — from $77 average (pre-war) to $85 (March 22, post-Hormuz closure) to $99 Q2 (pre-ceasefire) to $90 Q2 (post-ceasefire). A fourth revision before May 5 is plausible if Day 3 through Day 7 data confirms that the LNG normalisation assumption has failed. However, Aramco’s pricing committee cannot wait for Goldman’s revision cycle: the June OSP must be finalised based on market conditions as of late April.
What happens to the 14 stranded LNG cargoes if Hormuz does not fully reopen?
The fourteen laden LNG cargoes trapped inside the Gulf represent approximately $900 million to $1 billion in cargo value at current JKM Asian spot prices of $19.83-19.97 per MMBtu. LNG cargoes have a finite shelf life — boil-off reduces cargo volume by roughly 0.1 per cent per day, meaning each day of delay reduces delivered volume and commercial value. If Hormuz remains restricted to twelve vessels per day under Iranian vetting, LNG tankers must compete with oil tankers, bulk carriers, and container ships for limited transit slots. Qatar’s force majeure declaration on March 4 shifted contractual liability from QatarEnergy to the geopolitical event, but buyers in Asia remain short supply with no contractual recourse to alternative sources at contracted prices.
Why does Goldman’s TTF gas forecast matter for oil prices?
The TTF (Title Transfer Facility) benchmark governs European natural gas pricing and drives gas-to-oil substitution economics across European and Asian power generation. When TTF exceeds approximately 70-75 EUR/MWh, power utilities that can switch between gas and oil-fired generation shift toward oil, adding 300,000 to 500,000 bpd of incremental crude demand globally. Goldman cut TTF to 50 EUR/MWh on the same mid-April LNG assumption underpinning the $90 Brent call. If TTF stays above 75 EUR/MWh — Goldman’s own trigger level — the demand-side support for crude prices remains, and the $90 floor thesis strengthens rather than the $90 ceiling thesis Goldman intended.