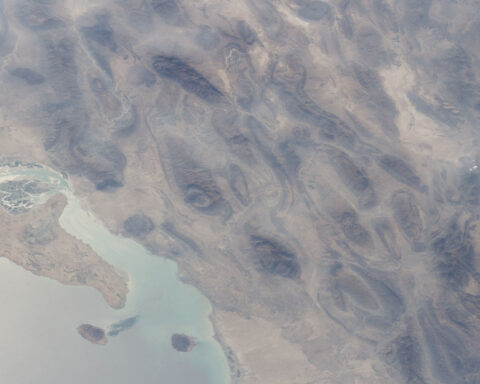
DHAHRAN — At 09:14 GMT on April 29, Brent crude touched $114.50 a barrel, a number that should mean disaster in a kingdom that has lost three out of every ten barrels it used to pump. Instead it means something stranger. Saudi Arabia’s daily oil revenue at $114.50 with 7.25 million barrels per day is functionally identical to its pre-war revenue at $80 with 10.4 million — the crossover threshold sits at $114.76, twenty-six cents above where the market closed.
The arithmetic is unsentimental. Pre-war Saudi Arabia earned roughly $832 million a day from crude exports. After eight weeks of Iranian missile damage to the eastern fields and the Khurais shutdown, the kingdom is pumping 7.25 million barrels — and at today’s price, generating around $830 million a day. The volume is gone. The revenue, somehow, is not. That changes how Riyadh thinks about ceasefire urgency, fiscal endurance, and the price tag attached to peace. The price-volume gap that has defined Saudi war economics since early March has, for one trading session, closed.
Table of Contents
- Why $114.76 Is the Number That Matters
- Has Saudi Arabia Cleared Its Fiscal Break-Even?
- What Do War Costs Do to the Surplus?
- Why Can’t Saudi Arabia Just Pump More Through Yanbu?
- The Price Signal Riyadh Is Sending on Peace
- Does the EIA Forecast Hold the Window Open?
- How This Differs From 1973 and 2019
- Does MBS Now Have a Reason to Let the War Run?
- The Fiscal Arithmetic at $114.50 Brent
- The Twenty-Six Cents
- Frequently Asked Questions
Why $114.76 Is the Number That Matters
The crossover threshold is not a forecast or a target. It is what falls out of two multiplications. Pre-war volume of 10.4 million barrels per day at an $80 Brent reference yields $832 million per day in gross export revenue. To match that with the kingdom’s current March-confirmed throughput of 7.25 million barrels — the figure the IEA logged as “the largest disruption on record” — the price has to do all the work that the missing 3.15 million barrels used to do. Solve for price and the answer is $114.76.
That number sat in the realm of pure spreadsheet exercise for most of April. Brent traded $93–99 through the second week of the month, lifted into triple digits after the Vance walkout from Islamabad, and only crossed $110 once OPEC+ confirmed it would hold the April quota fiction in place rather than try to backfill the Saudi gap. April 29 brought the trade within 0.23 percent of the line. For purposes of daily fiscal arithmetic, the kingdom is now earning what it earned before Iran’s first missile crossed the Gulf.
Stating this so flatly matters because almost nothing else in Saudi war economics holds steady. SAMA’s reserves are drawing down at $8 to $12 billion a month from the February peak of $475 billion. The 2026 NDMC borrowing plan was sized at $57.87 billion against a budget designed for $75–85 Brent and 10 million barrels a day. The IMF cut Saudi 2026 GDP growth from 4.5 percent to 3.1 percent in its April 14 World Economic Outlook. Every variable the kingdom tracks is moving against it — except the one that matters most for getting cash into Treasury.
Has Saudi Arabia Cleared Its Fiscal Break-Even?
There are two break-even prices, and the answer depends entirely on which one the question means. The IMF’s October 2025 calculation — the central-government-only figure that ignores Public Investment Fund obligations — sits at $86.60 per barrel. By that measure Saudi Arabia has been clearing fiscal break-even since the second week of April, and on April 29 is clearing it by nearly $28. The kingdom’s headline budget, narrowly defined, is in the black on a daily run-rate basis.
The Middle East briefing 3,000+ readers start their day with.
One email. Every weekday morning. Free.
The relevant number is not the IMF’s. Bloomberg Economics (Ziad Daoud) maintains a PIF-inclusive break-even because the Public Investment Fund’s commitments — NEOM, The Line, the Red Sea projects, AlUla, the gigaprojects portfolio that constitutes Vision 2030’s physical balance sheet — are sovereign obligations even when they sit outside the Ministry of Finance’s books. That number is $108–111 per barrel. At $114.50, Saudi Arabia clears the PIF-inclusive line by $3.50 to $6.50 a barrel. On 7.25 million barrels per day, that is a surplus of $25 to $47 million a day above the comprehensive break-even.
The man running PIF acknowledged the trade-off publicly on April 22. “Is it necessary to deliver The Line in 2030?” Yasir Al-Rumayyan asked Semafor. “I don’t think so.” The break-even arithmetic does not require Saudi Arabia to abandon Vision 2030 at $114 Brent. It does require the kingdom to slip the schedule, and it has done so. Finance Minister Mohammed Al Jadaan, speaking the same day, framed the daily-life consequence in language designed for foreign creditors: “If one ignores a lot of the noise, you see what’s happening in day-to-day life. If you go to people in Riyadh, they largely didn’t feel that there was a war.”
That sentence is not an editorial flourish. It is a sukuk pitch. The kingdom raised $4.52 billion in 15-year paper in mid-April, demonstrating that wartime market access is intact, but the borrowing plan was sized for a peacetime price deck. Higher Brent eases the borrowing pressure even as it confirms the war’s economic geography.

What Do War Costs Do to the Surplus?
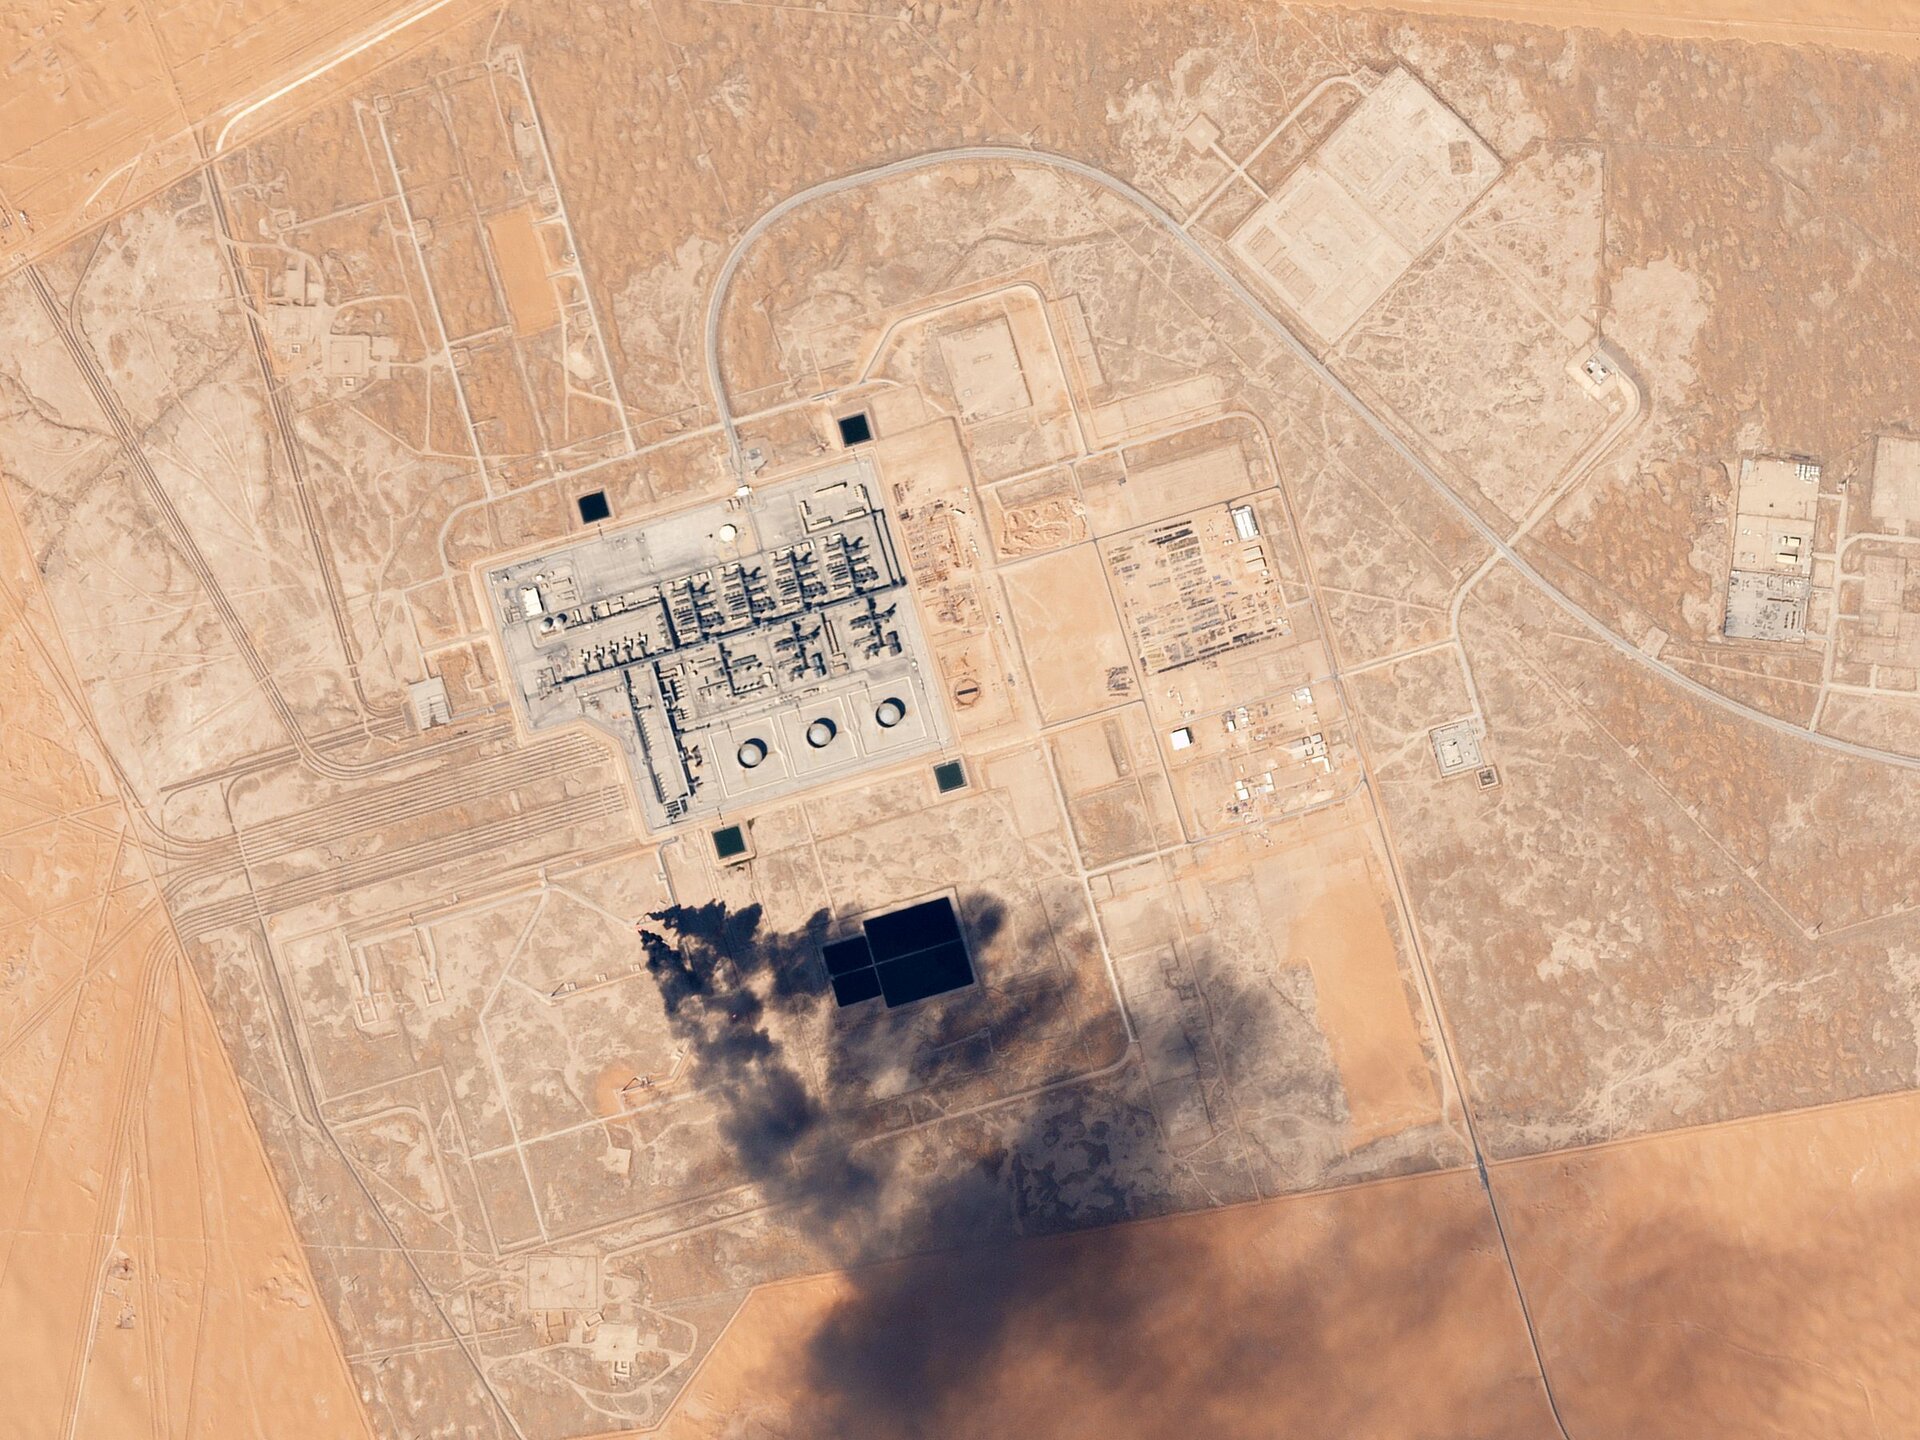
The crossover arithmetic is gross revenue, not net. War is a cost line, and in Saudi Arabia’s case the cost line is enormous. SAMA reserves analysis through Q1 2026 puts air-defence interceptor expenditure alone at $150–250 million per day. Total daily war costs — interceptors, sortie-rate fuel, pre-positioned munitions replenishment, base-hardening at NSA Bahrain and Prince Sultan, and the King Salman Air Base reconstitution after the March hits — run somewhere between $300 and $500 million per day in working estimates that have not been officially disclosed.
Set those numbers next to the $25–47 million daily surplus over PIF-inclusive break-even and the apparent fiscal sufficiency dissolves. At the midpoint, war is costing Saudi Arabia $400 million a day against a crossover surplus of roughly $35 million. That leaves a daily war-cost gap of $365 million that the kingdom is funding from reserves drawdown and incremental borrowing, not from operating cash flow.
Goldman Sachs put a number on what the gap means at the GDP level. The bank’s war-adjusted deficit estimate is 6.6 percent of GDP, against the Ministry of Finance’s official 3.3 percent projection — a doubling, or roughly $80–90 billion versus $44 billion. The crossover at $114.76 narrows that gap but does not close it. The World Bank’s April 28 Commodity Markets Outlook forecast a 24 percent surge in energy prices for 2026 and described the convergence of Hormuz interdiction and Saudi production loss as “the largest energy security threat in history.” The component of the deficit gap that expands even when Brent is above break-even — rising domestic subsidy and transfer obligations from a recovering non-oil economy — is examined in Saudi Arabia’s Economy Is Recovering. That Is the Problem.
The honest read on the surplus is therefore conditional. Saudi Arabia has crossed the gross-revenue line. It has not crossed the net-of-war-costs line. The crossover is real for the parts of the budget that fund civil expenditure and PIF capital calls. It is illusory for the parts that fund interceptors and air sorties. The same ceiling that defines the fiscal crossover point also imposes a structural paradox: at $114, Saudi Arabia sits three dollars above its fiscal break-even and three dollars below the price the IMF associates with global recession — a seven-dollar band in which war budgets and Vision 2030 must coexist.
Why Can’t Saudi Arabia Just Pump More Through Yanbu?
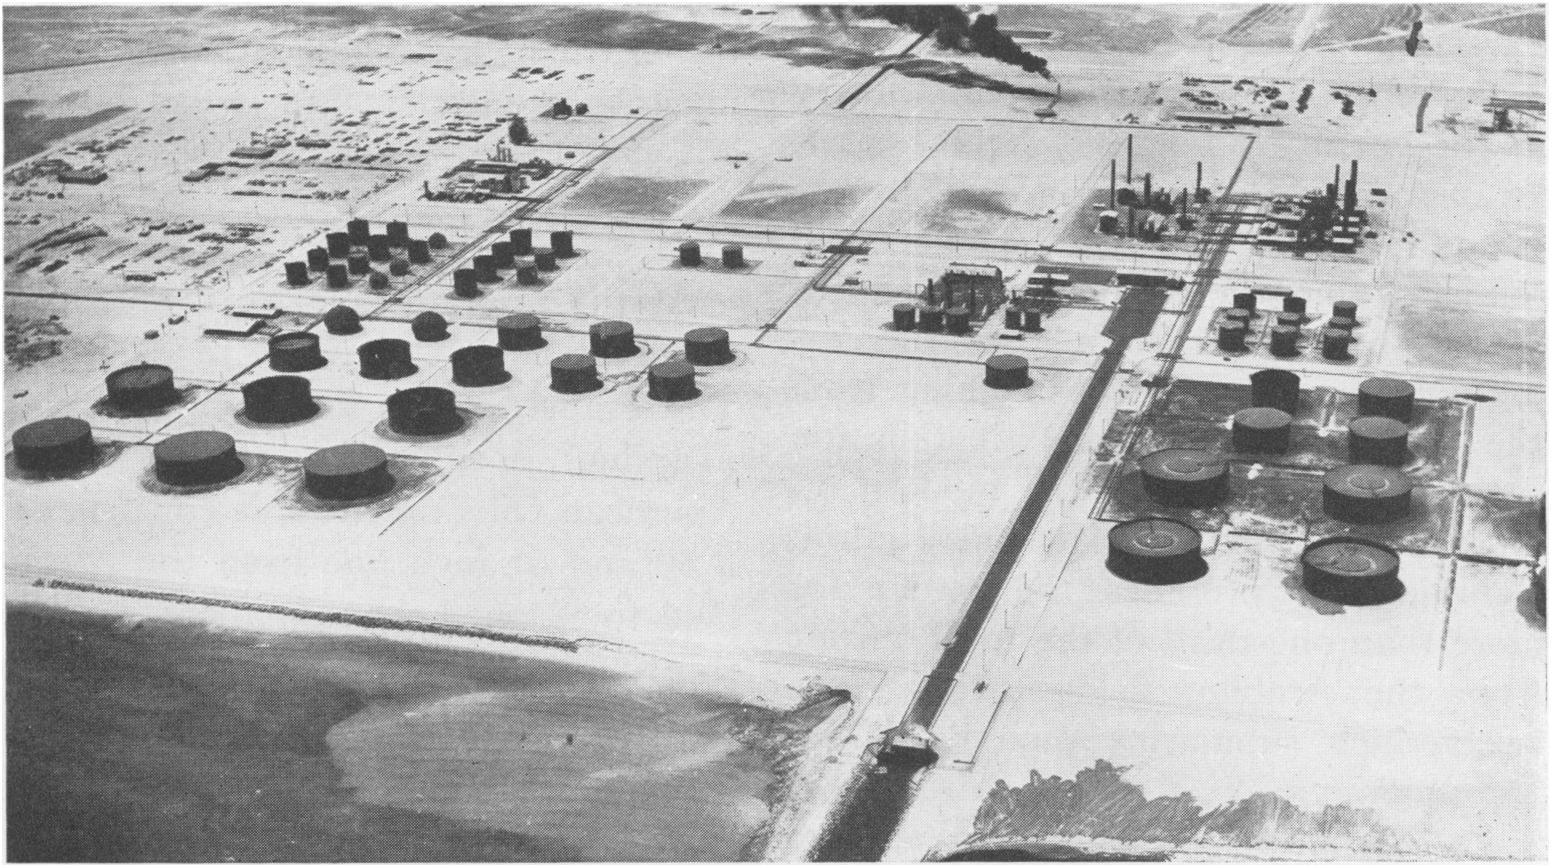
The crossover threshold assumes 7.25 million barrels per day of throughput. Higher production would lower the price needed to match pre-war revenue. The reason 7.25 is the operating reality, rather than a policy choice, is the Yanbu bottleneck — and that bottleneck is more constrained than even most market commentary acknowledges.
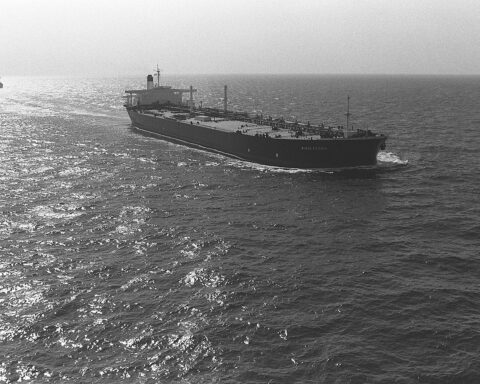
The East-West Petroline runs 1,200 kilometres from the Eastern Province fields to the Red Sea coast. Its nameplate capacity is 7 million barrels per day. The pipeline itself is intact; the IRGC pumping-station strike on April 8 took capacity offline only briefly. The constraint is at the port. Yanbu’s tested loading ceiling is approximately 4 million barrels per day — limited by berth availability, the number and configuration of loading arms, and the storage cycling required to hold cargo between pipeline arrivals and tanker scheduling. Argus Media’s working figure for the pipeline-to-port gap is 3 million barrels per day even with the line undamaged. The Yanbu ceiling applies to crude alone; the LPG artery through Juaymah NGL terminal, offline since February 23, adds a second impaired export channel that the price-revenue crossover analysis does not capture — a compounding factor examined in Juaymah’s LPG Shutdown Is the Missing Half of Aramco’s Export Crisis.
There is a grade problem on top of the volume problem. Yanbu’s terminal infrastructure was built around Arab Light and Arab Extra Light. The pipeline cannot move Arab Heavy or Arab Medium at any meaningful rate, which means the grades that account for the bulk of Asian refining contracts — including the Chinese teapot demand that Saudi Aramco priced its June OSP for at +$3.50 per barrel — physically cannot reach a non-Hormuz terminal. The OSP reset from May’s +$19.50 wartime premium to June’s +$3.50 reflects that grade reality. Saudi Arabia is selling Arab Light at war prices and conceding that the heavier barrels are stranded.
The volume floor of 7.25 million barrels per day is therefore not a target Saudi Arabia is choosing to hold. It is the structural ceiling of the bypass route, plus whatever Eastern Province throughput the kingdom can still risk pushing toward Hormuz under IRGC interdiction. Until either Hormuz reopens or Yanbu’s berth and storage infrastructure is expanded — a multi-year project that Aramco has scoped but not commissioned — 7.25 is what the system can do.
The Price Signal Riyadh Is Sending on Peace
If the kingdom’s fiscal position were genuinely desperate, ceasefire terms would be cheap. They are not cheap. Riyadh’s five demands — a binding US defence pact, recognised enrichment rights, the F-35 sale, Iranian reparations for infrastructure damage, and permanent missile-program degradation — are priced more aggressively than the demands the kingdom was making before the war. That is the diplomatic tell.
The market has been giving Saudi Arabia an additional signal in the opposite direction. On March 25, Brent fell below $100 on the first wave of credible ceasefire reporting. Within a single trading session the price hedge that funds the war evaporated. Every move toward de-escalation costs the kingdom roughly $10–15 per barrel in spot terms — on 7.25 million barrels a day, that is $73 to $109 million in daily revenue. Peace, in the kingdom’s working spreadsheet, is a revenue cut.
This is the inversion that gives the Brent crossover its diplomatic weight. War volume times war price equals pre-war volume times pre-war price. Peace pulls the price back down without restoring the lost volume — at least not on any timeline that matches the price decay. Yanbu cannot expand to 7 million bpd in months. Eastern Province repair on the damaged installations will take quarters. A ceasefire that drops Brent to $90 against unchanged 7.25 million bpd output yields $652 million per day, or $180 million below the pre-war baseline. Saudi Arabia would be back below break-even on the comprehensive measure.
Iranian Foreign Minister Abbas Araghchi called Saudi FM Faisal bin Farhan on April 26 to brief him on what Xinhua described as “latest efforts to end the war.” The behavioural read on the call is that Tehran understands the price asymmetry as well as Riyadh does. Iran earned approximately $9 billion over 40 days by boosting exports to 1.85 million bpd before the US blockade hit on April 13, and is now losing $150 million per day in oil revenue to interdiction. Iran needs the war to end. Saudi Arabia, on the gross-revenue line at least, does not. A separate physical deadline tightens the window further: Wood Mackenzie estimates Iran has 12–22 days of remaining storage capacity at Kharg Island, after which blocked exports would force production cuts regardless of any diplomatic status.
Does the EIA Forecast Hold the Window Open?
The crossover is a snapshot. The forward curve is what matters for whether the kingdom can wait out the war on its current cash-flow trajectory. The EIA’s April 2026 Short-Term Energy Outlook puts Brent at a Q2 2026 peak of $115, declining to $88 by Q4 2026, and averaging $76 across 2027. The World Bank’s April 28 outlook is more bifurcated — $86 baseline for the full year, $115 only in the high-escalation scenario.
Both forecasts agree on the shape: a wartime peak around current levels, then a sharp reversion as either Saudi production recovers, Hormuz reopens, or both. The fiscal-comfort window the crossover defines is therefore narrow. If Brent averages $115 from April through the end of Q2, Saudi Arabia generates approximately $830 million per day in gross export revenue across roughly 90 days — a $74.7 billion war-window revenue base that exceeds the pre-war-equivalent figure by a small margin. By Q4, at $88 Brent and unchanged volume, daily revenue falls to $638 million. That is the cliff.
The trajectory makes the kingdom’s fiscal calculus front-loaded. Every week that the war continues at $110-plus Brent buys Saudi Arabia roughly the equivalent of pre-war revenue. Every week after Q2 that the war continues at $90 Brent costs the kingdom $1.4 billion against the pre-war baseline. The window in which fighting is fiscally tolerable closes faster than the window in which the kingdom’s strategic demands get met.
That is what the EIA and World Bank numbers actually mean for Riyadh. Not that war is profitable indefinitely. That war is fiscally tolerable for the second quarter and unaffordable by the fourth. The diplomatic pressure on the Saudi side is therefore time-shaped, not price-shaped. The kingdom’s leverage on its five demands lasts as long as the price deck stays inverted — and not a day longer.
How This Differs From 1973 and 2019
The 1973 OAPEC embargo produced the original revenue-on-restricted-volume arithmetic. Arab producers cut supply, prices quadrupled, and revenue rose against the volume cut. The structural difference is that 1973 was strategic and 2026 is forced. OAPEC chose its volume reduction. Saudi Arabia, in 2026, did not. The kingdom is taking the revenue benefit of higher prices without having authored the shortage that produced them.
The closer parallel is the September 2019 Abqaiq-Khurais drone strike, which knocked 5.7 million barrels a day offline in a single morning. Brent spiked 19.5 percent intraday — the largest single-day intraday move on record. Within two weeks, Saudi Arabia had restored production. Within three weeks, prices were back below pre-strike levels. The 2019 shock vindicated the proposition that Saudi production was resilient and the price effect of disruption would be brief.
2026 has inverted both legs of that lesson. The volume loss is structural, not transient. Eight weeks in, with Khurais still offline and no announced restoration timeline, the kingdom is operating at 70 percent of pre-war capacity. The price effect is therefore not the spike-and-fade pattern of 2019 but a sustained elevation that approaches the revenue-replacement threshold rather than overshooting it briefly. The market has priced the disruption as durable.
The 1973 lesson and the 2019 lesson point in opposite directions. 1973 says producers can profit from cutting supply if they control the cut. 2019 says markets quickly forgive disruption that gets repaired. 2026 fits neither template. Saudi Arabia is profiting from a cut it did not choose and cannot quickly repair, and the market has accepted that this is the new operating regime for the second quarter at minimum.
Does MBS Now Have a Reason to Let the War Run?
The honest answer is partial. On the gross-revenue line, the crossover gives Riyadh a fiscal floor that did not exist a month ago. On the net-of-war-costs line, the kingdom is still bleeding $365 million every day. The variable that matters is which line drives the policy.
The behavioural evidence points to the gross-revenue line driving negotiating posture and the net-of-war-costs line driving operational caution. MBS’s five-demand list has not been softened since the war began; if anything, the enrichment-rights demand has hardened in response to the US-Saudi 123 draft. That is consistent with a kingdom that is fiscally able to wait. At the same time, Saudi air-defence expenditure has been throttled — interceptor allocations have been managed more tightly since mid-April — which is consistent with a kingdom that is operationally cost-conscious. Riyadh is pricing peace high while spending war frugally.
The structural risk is the trajectory the EIA has mapped. If Brent retraces to $88 by Q4 with Yanbu still capped at 4 million bpd and Eastern Province repair incomplete, the kingdom slides back below comprehensive break-even with the war still running and the strategic demands still unmet. The rational calculation is therefore to convert the Q2 fiscal cushion into Q4 leverage — to extract maximum diplomatic concession during the price window and accept a deal before the price window closes.
The IRGC’s residual capability, by recent National Security News reporting, sits at roughly 60 percent of naval arm and 50 percent of ballistic missile stockpile at Day 60. Iran can keep fighting. Saudi Arabia, on the gross-revenue line, can afford to let it. On the net-of-war-costs line, neither side can afford the second half of the year. That is the structural setup the crossover threshold has put in place, and it is why Riyadh is currently negotiating like a creditor rather than a debtor.
The 1973 Arab oil ministers controlled their own arithmetic. MBS controls the pricing, in the sense that Saudi production discipline holds Brent above $110, but he does not control the volume — Iranian missiles and Yanbu’s berth count do. Within those constraints, the April 29 crossover is what passes for fiscal good news in a war that has cost the kingdom $80 billion at the GDP level and counting. Hours after markets closed on April 29, Trump posted an AI gun image warning Iran with the caption “NO MORE MR. NICE GUY” as Tehran simultaneously asserted formal sovereignty rights over Hormuz — a pairing that analysts said reset the ceasefire probability lower and the price floor higher.
The Fiscal Arithmetic at $114.50 Brent
The numbers below summarise the daily run-rate position on April 29, 2026, before war costs are applied.
| Metric | Pre-War Baseline | April 29, 2026 | Delta |
|---|---|---|---|
| Brent reference price | ~$80/bbl | $114.50/bbl | +$34.50/bbl (+43%) |
| Saudi crude output | 10.4M bpd | 7.25M bpd | -3.15M bpd (-30%) |
| Daily gross export revenue | $832M/day | ~$830M/day | -$2M/day (effectively even) |
| IMF break-even (central govt) | $86.60/bbl | Cleared by $27.90 | n/a |
| PIF-inclusive break-even | $108–111/bbl | Cleared by $3.50–6.50 | n/a |
| Daily war cost (estimated) | $0 | $300–500M/day | +$300–500M/day |
| SAMA reserves | $475B (Feb 2026 peak) | ~$455B (April est.) | -$20B in 60 days |
| Goldman war-adjusted deficit | 3.3% GDP (official) | 6.6% GDP | +3.3 pts (~$45B/yr) |
| Crossover threshold | n/a | $114.76/bbl | $0.26 above April 29 close |
The Twenty-Six Cents
The market closed at $114.50. The threshold sits at $114.76. Twenty-six cents separates the kingdom from a wartime daily revenue line equal to its peacetime baseline, and the spread will close in either direction within hours of the next news cycle from Islamabad. What it cannot close is the Yanbu berth count, the Khurais shutdown, or the structural fact that Saudi Arabia is generating pre-war money on post-war volume only because Iranian missiles have made the price do the work the barrels used to do.
Al Jadaan’s line about Riyadh not feeling the war is the line of a finance minister whose price chart is co-operating. By Q4, on the EIA’s own numbers, the chart will not. The Q2 window is open. The kingdom’s negotiating posture will harden as long as the window holds — and collapse the moment it closes.
Frequently Asked Questions
What is the Brent crossover threshold for Saudi Arabia in 2026?
The crossover threshold is $114.76 per barrel — the price at which Saudi Arabia’s wartime output of 7.25 million barrels per day generates the same gross daily revenue as its pre-war output of 10.4 million barrels at $80 Brent ($832 million per day). On April 29, 2026, Brent traded at $114.50, within $0.26 of the line. The threshold is a gross-revenue concept: it does not account for war costs, which are running an estimated $300–500 million per day and are funded separately through SAMA drawdowns and the 2026 NDMC borrowing programme.
What is Saudi Arabia’s actual fiscal break-even price?
Two break-evens are in use. The IMF’s October 2025 central-government figure is $86.60 per barrel. Bloomberg Economics’ PIF-inclusive break-even — covering Vision 2030 commitments such as NEOM and The Line — is $108–111. The gap between the two ($21–24 per barrel) represents the PIF’s off-balance-sheet sovereign drag. Saudi Arabia cleared the PIF-inclusive line on approximately April 19-20, roughly a week before the April 29 crossover of the gross-revenue threshold — meaning the kingdom has been nominally in surplus on the comprehensive measure for about ten days.
Why can’t Saudi Arabia produce more than 7.25 million barrels per day?
The binding constraint is the Yanbu loading ceiling of approximately 4 million barrels per day — not pipeline capacity, which runs to 7 million bpd. Yanbu’s berth and loading-arm infrastructure was built for Arab Light and Arab Extra Light; the terminal cannot handle Arab Heavy or Arab Medium. Aramco has internal scoping studies for a Yanbu expansion capable of adding 1.5–2 million bpd of loading capacity, but the project requires 18–24 months minimum from commission to first barrel — meaning no relief before mid-2028 at the earliest under any realistic construction schedule. The threat to Yanbu’s Red Sea exit route — how the Bab el-Mandeb threat closes Saudi Arabia’s Yanbu bypass and locks the kingdom’s dual-chokepoint exposure — is examined in detail in Saudi Arabia’s Yanbu Bypass Is About to Lose the Only Strait That Made It Work.
How does this compare with the 2019 Abqaiq-Khurais attack?
2019 took 5.7 million barrels per day offline and was repaired within two weeks; Brent spiked 19.5 percent intraday and reverted within three weeks. The 2026 volume loss of 3.15 million bpd is smaller in headline terms but is structural rather than transient — eight weeks in with no announced restoration timeline. There is one further distinction markets appear to be pricing: in 2019, Saudi Arabia’s full spare capacity was available and visible. In 2026, Hormuz interdiction has effectively removed the spare-capacity safety valve from the global supply picture, which is why the price signal has not faded the way it did in 2019.
Does the Brent crossover give MBS an incentive to prolong the war?
Partially, on the gross-revenue line. The more precise read is that the crossover converts a crisis negotiation into a patient one: Riyadh is no longer negotiating from a position of fiscal emergency, but it is also not earning a war profit net of costs. The kingdom’s five strategic demands — US defence pact, enrichment rights, F-35s, Iranian reparations, permanent missile degradation — were set before the crossover was reachable and have not been softened since. What the crossover changes is the time horizon. Saudi Arabia can afford to hold those terms through Q2 at $110-plus Brent. It cannot afford to hold them into Q4 at the EIA’s forecast of $88.
What did the IMF and World Bank say about Saudi Arabia in April?
The IMF cut Saudi 2026 GDP growth from 4.5 percent to 3.1 percent in its April 14 World Economic Outlook, citing volume loss against partial price offset. The World Bank’s April 28 Commodity Markets Outlook forecast a 24 percent surge in energy prices for 2026 — baseline Brent at $86, high-escalation scenario at $115 — and described Hormuz interdiction combined with Saudi production loss as “the largest energy security threat in history.” Goldman Sachs’s war-adjusted Saudi deficit estimate is 6.6 percent of GDP, double the official 3.3 percent. Taken together, the three institutions have bracketed the fiscal position: the kingdom is earning near pre-war revenue while running a GDP-level deficit almost twice the one it reported to markets.