DHAHRAN — The last tanker to exit the Strait of Hormuz before the war departed on February 28, and JPMorgan calculates that its cargo reached its final destination on approximately April 20 — today. Every barrel of crude oil that a refinery in Asia, Europe, or the Americas burns from this point forward is a barrel drawn from a stockpile that is not being replaced at anything close to the rate it is being consumed.
The distinction matters more than the date. Before today, the 51-day slide from $109 Brent to $98 could be read as futures traders pricing competing scenarios — ceasefire, escalation, Yanbu bypass. After today, any refinery that runs dry is not running dry because a trader mispriced a contract. It is running dry because the oil is physically gone, and Saudi Arabia’s bypass infrastructure cannot fill the hole fast enough to prevent it.
Table of Contents
The JPMorgan Pipeline Calculation
Natasha Kaneva, JPMorgan’s head of commodity strategy, published what has become the definitive supply shockwave roadmap on March 26. Her team tracked the final pre-closure VLCC tankers from their February 28 departure through the standard 14-to-18-day transit to Asian ports and the subsequent 30-to-40-day refinery draw cycle. The arithmetic yielded a pipeline clearance window of approximately 50 to 58 days — landing on or around April 20.
Kaneva described the disruption as cascading “sequentially rather than simultaneously — spreading westward, dictated by shipping times and unevenly cushioned by regional inventories.” Asia felt it first, because Asia is closest. Europe felt it next. The United States, with its domestic shale production and strategic petroleum reserve, felt it last and least — but the buffer is shrinking there too.
JPMorgan’s initial estimate of the gross supply shock was approximately 16 million barrels per day sidelined from global markets, easing toward 10 million bpd by April as alternative routes — principally Saudi Arabia’s East-West Pipeline to Yanbu and the UAE’s Fujairah bypass — came partially online. The IEA’s April Oil Market Report confirmed the scale: global supply fell 10.1 mb/d to 97 mb/d in March, with cumulative supply losses exceeding 360 million barrels in March and a projected 440 million barrels in April. Fatih Birol, the IEA’s executive director, called it “the biggest threat to energy security in history, worse than the two oil shocks of the 1970s and the Russia-Ukraine war combined.”
From March through early April, governments, businesses, and consumers collectively drew down approximately 250 million barrels of reserves — 6.6 million barrels per day — to cushion the shock, according to JPMorgan. That cushion is now exhausted or nearly so, and what replaces it is not the Hormuz supply chain returning. It is an improvised network of bypass pipelines, Cape of Good Hope reroutes that add 14 to 16 days and $810,000 to $990,000 per VLCC voyage, and strategic reserve releases that amount to approximately four days of pre-war global consumption.
The Middle East briefing 3,000+ readers start their day with.
One email. Every weekday morning. Free.
Why Are Physical and Futures Prices $35 Apart?
The number most people see when they check oil prices — Brent futures at roughly $98 per barrel — is not the number that refineries pay. The number refineries pay is Dated Brent, the spot benchmark for physical crude scheduled for delivery within 10 to 30 days, and that number hit an all-time high above $144 per barrel last week before settling around $131 to $133. The spread between the two — approximately $35 to $38 — is the largest in recorded market history, according to Morgan Stanley, which described it as “a much more violent shock in physical Brent-linked barrels compared to the main financial contract.”
The gap exists because futures contracts price probability-weighted scenarios across months of forward delivery, while physical crude prices the barrel a refinery needs this week. Dubai-linked crude, which prices the bulk of Asian purchases, traded at $138 to $140 per barrel. Middle distillates in Singapore — jet fuel, diesel — exceeded $290 per barrel. A refinery operator in Japan or South Korea paying those prices is not making a speculative bet. That operator is paying what the cargo costs because the alternative is shutting down units, laying off workers, and telling airlines and trucking companies that the fuel does not exist.
The April 17-to-18 Hormuz whiplash demonstrated exactly how this disconnect functions. When Iran’s Foreign Minister Araghchi declared the Strait “completely open” on April 17, Brent futures crashed 11.5 percent to $87.94 in a single session. Physical crude barely moved, because traders who actually load tankers understood what the IRGC’s operational authority over the strait meant for Araghchi’s announcement: nothing. Within 18 hours, IRGC gunboats fired on a tanker without VHF warning. Iran re-closed the Strait on April 18. Brent futures recovered toward $98 by April 19. The physical market had never left.
How Long Do OECD Inventories Last?
JPMorgan defines the OECD commercial crude “operational minimum” at approximately 30 days of forward refining throughput cover, or about 842 million barrels. Starting inventory stood at roughly 968 million barrels — already below comfortable buffer levels at approximately 27 days of cover. The April drawdown is projected at 166 million barrels, with an additional 67 million barrels projected for early May. That arithmetic puts OECD inventories at approximately 735 million barrels — more than 100 million barrels below JPMorgan’s operational minimum — by the time the second-quarter refinery maintenance season ends.
Global observed inventories fell 85 million barrels in March alone, according to the IEA, with stocks outside the Middle East Gulf drawn down at a rate of 6.6 mb/d. Even if refiners double their current production cuts — which would accelerate the demand destruction already underway — inventories still hit the floor. Kaneva’s team was explicit: the buffer space is at its limit.
The IEA’s 32-member coordinated strategic reserve release of 400 million barrels, announced on March 11, bought time. It did not buy a solution. Four hundred million barrels is roughly four days of pre-war global oil consumption. Governments treated it as a bridge to a ceasefire that has not materialized. The ceasefire expires on April 22 — two days from now — and the Touska seizure on April 19 has made renewal less likely, not more.
Saudi Arabia’s Fiscal Trap
Saudi Arabia’s production collapsed from 10.4 mb/d in February to 7.25 mb/d in March — a 3.15 mb/d decline that the IEA confirmed in its April report. The kingdom’s OPEC+ quota stands at 10.2 mb/d, meaning actual output runs 2.95 mb/d below what Riyadh is entitled to pump. The gap is not voluntary restraint. It is the physical consequence of Khurais sitting at 300,000 bpd offline with no restoration timeline, combined with a Yanbu port bottleneck that limits effective loading to roughly 4 mb/d against the East-West Pipeline’s 7 mb/d nameplate capacity.
That port bottleneck traps 2.5 to 3 mb/d of Saudi crude — oil that has been pumped, transported across the peninsula, and sits in Yanbu storage tanks waiting for berths that process tankers slower than the pipeline delivers. Argus Media reported the Yanbu monthly average throughput at just 2.6 mb/d in March, with a peak of 4 mb/d in a single week. The net result is a structural Saudi export gap of 4 to 5 mb/d compared to pre-war levels.
The fiscal arithmetic compounds the physical constraint. Ziad Daoud of Bloomberg Economics calculates the PIF-inclusive Saudi fiscal break-even at $108 to $111 per barrel. Brent futures sit at $98. Dated Brent at $131 narrows the gap for spot sales, but the kingdom’s term contracts — the majority of its exports — price off the futures-linked Official Selling Price, not the spot market. Farouk Soussa, Goldman Sachs’ MENA economist, estimates the war-adjusted Saudi deficit at 6.6 percent of GDP, double the official 3.3 percent forecast, translating to approximately $73 billion in annual drawdown. The June OSP has already been reset $16 lower from May’s war-premium level, a tacit acknowledgment that Aramco cannot hold buyers to prices set when Brent was $109.
The Asian Refinery Crunch
Japan, which depends on the Middle East for roughly 95 percent of its oil imports with approximately 70 percent transiting Hormuz, saw refinery utilization fall to 67.7 percent of capacity in early April — the lowest since June 2025, according to 19FortyFive and IEA data. South Korea has not received a single Middle Eastern cargo since March 20. Seoul secured 110 million barrels of alternative crude from 17 countries spanning Africa, the Americas, and non-Hormuz Gulf terminals for April and May, according to S&P Global, but the sourcing came at premium prices and longer lead times that erode refining margins.
South Korea’s improvisation extended to reviving Russian naphtha imports for the first time in four years, a move the Moscow Times reported on March 30. The purchases reflect desperation more than strategy: the feedstock South Korean petrochemical plants need is not fungible with whatever crude is cheapest on the global market. Grade matters, delivery timing matters, and sulfur content matters. Asian crude stocks dropped 31 million barrels in March, with further declines expected through April, per the IEA.
Fujairah, the UAE’s primary bunkering and storage hub outside the Strait, tells the story in a single dataset. Total oil product stocks fell to 12.555 million barrels in the week ending April 6 — the lowest on record, according to S&P Global. By April 15, refined product inventories dropped below 10 million barrels, a nine-year low. Heavy distillates fell below 5 million barrels. The total has declined 40 percent since March 2. Fujairah itself has been attacked at least six times since the war began, adding infrastructure risk to the supply arithmetic.
The IEA’s demand destruction numbers quantify the economic damage. Global oil demand, which was forecast to grow by 730,000 bpd in 2026, is now projected to contract by 80,000 bpd — an 813,000 bpd swing. The second-quarter decline alone is projected at 1.5 mb/d, the sharpest contraction since COVID-19. But demand destruction is not demand disappearance. It is airlines canceling routes, trucking companies idling fleets, and petrochemical plants shutting cracker units — economic activity that does not come back on a schedule when supply returns.
The Touska Seizure and What Comes Next
The USS Spruance’s interception of the Iranian-flagged Touska on April 19 — the first physical seizure since the US blockade took effect — injected a new variable into a market already pricing the complete breakdown of the ceasefire framework. After a six-hour standoff in the Gulf of Oman, the Spruance disabled the Touska’s propulsion with 5-inch MK 45 fire into the engine room before Marines boarded. Iran’s Khatam al-Anbiya command accused the United States of violating the ceasefire and vowed retaliation. Tehran had already re-closed Hormuz on April 18 and rejected participation in the second round of Pakistan-mediated talks.
The ceasefire expires on April 22. JPMorgan warned that Brent could “overshoot toward $150 per barrel” if Hormuz stays effectively shut into mid-May, a scenario the bank briefly described as “retired” after the April 17 opening — and then immediately un-retired when the IRGC reversed Araghchi within hours. The $150 threshold matters because it is the level at which JPMorgan’s own models project refinery shutdowns cascading from Asia into Europe, as operators who cannot source crude at margins that cover their variable costs simply turn off the units.
China’s position complicates the picture. Windward estimates approximately 157.7 million barrels of Iranian crude at sea as of mid-April, with roughly 98 percent destined for Chinese ports. Combined with strategic and commercial reserves, China’s total cover exceeds 120 days of net imports — a buffer Beijing views as sufficient to outlast American coercive pressure. The expiry of OFAC General License U on April 19 eliminated the legal pathway Indian refiners used to purchase Iranian crude, closing a secondary valve precisely as the primary one ran dry. IOC’s 2-million-barrel VLCC Jaya purchase, settled in yuan via ICICI Bank’s Shanghai branch with 95 percent pre-payment, may be the last Indian-Iranian crude transaction for months.
Background
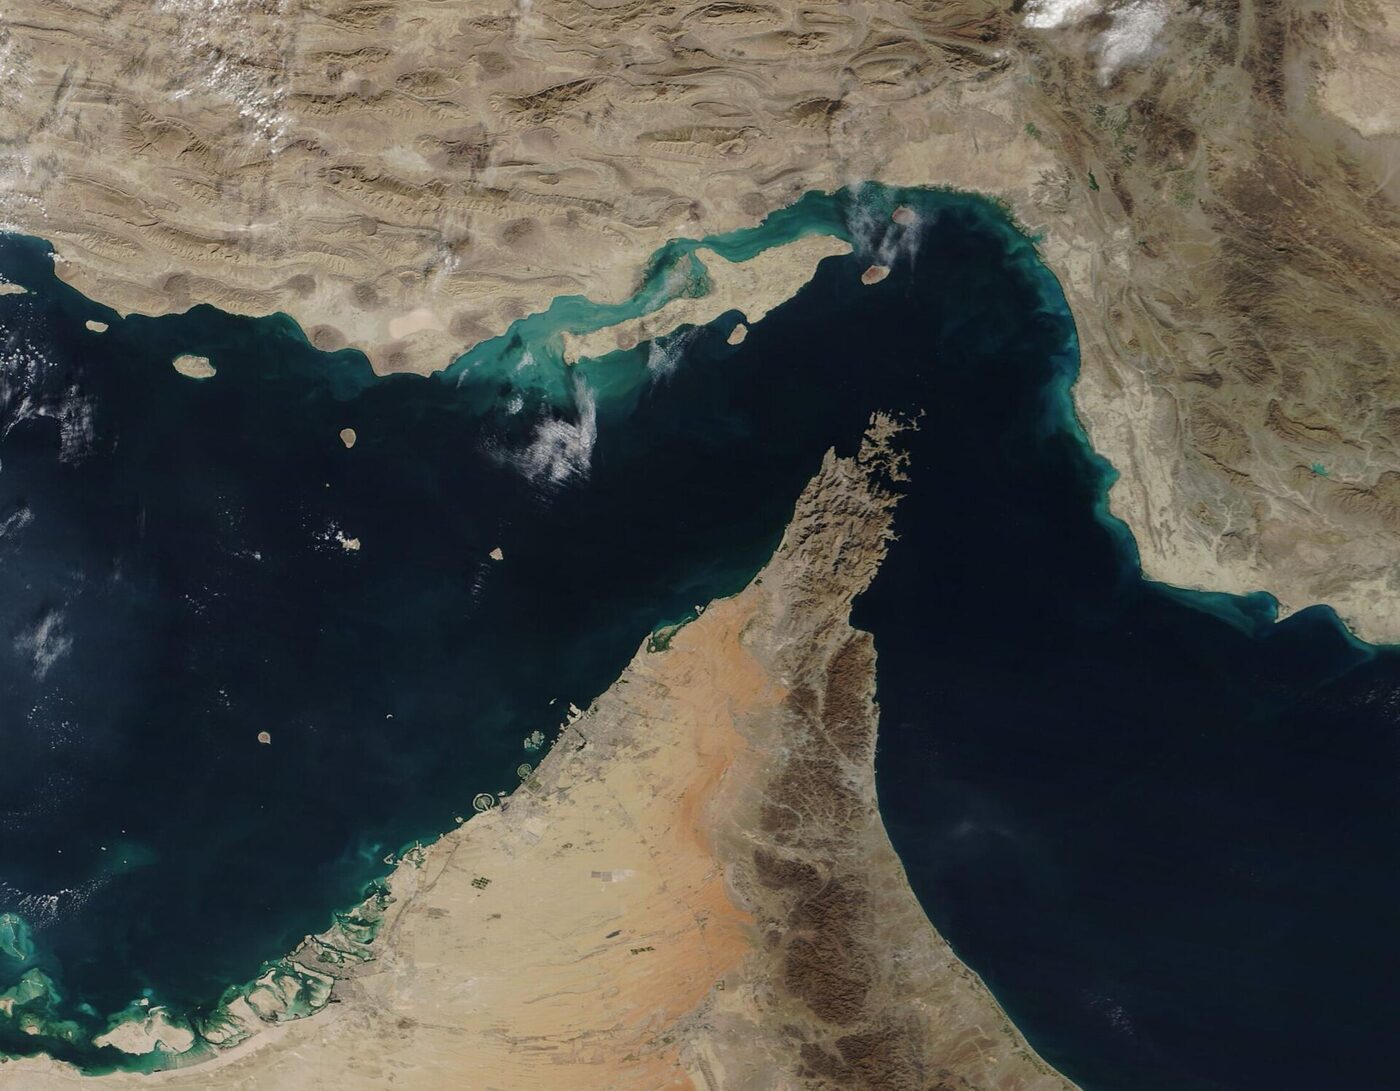
The Strait of Hormuz handled approximately 20 mb/d of crude and product flows before the war began on February 28, 2026. By early April, those flows had fallen to roughly 3.8 mb/d — an 81 percent decline — with tanker traffic down over 95 percent from the February baseline, according to Kpler and the IEA. The disruption dwarfs every precedent: the 2019 Abqaiq-Khurais drone attack disrupted 5.7 mb/d for approximately two weeks; the 1990 Iraqi invasion of Kuwait removed roughly 4.3 mb/d; the 1979 Iranian Revolution took 5.6 mb/d off the market. The current event exceeds all three combined and shows no structural pathway to resolution.
Alternative bypass capacity — the Saudi East-West Pipeline at 7 mb/d (restored April 12) and the UAE Fujairah pipeline at approximately 1.6 mb/d — provides a combined nameplate of 8.6 mb/d against the 20 mb/d that Hormuz once carried. Effective wartime throughput runs far below nameplate due to the Yanbu port bottleneck, Fujairah attacks, and the Cape of Good Hope rerouting that adds 11,000 nautical miles to Asia-Europe voyages. Iraq’s production, meanwhile, has collapsed from 4.3 mb/d pre-war to 1.3 mb/d, with Basra Oil Company managing just 900,000 bpd after the halt of southern port operations.
The central bank dilemma frames the macroeconomic response. The IMF raised its 2026 global inflation forecast to 4.4 percent, up 0.6 percentage points. The Federal Reserve holds rates at 3.5 to 3.75 percent. The ECB is holding. Raising rates compounds demand destruction in economies already absorbing energy-cost shocks. Cutting rates risks embedding energy-driven inflation into wage-price dynamics. The IEA’s April report projected 2026 global GDP growth at 3 percent, down from 3.4 percent the prior month — a revision that does not yet account for the post-April 20 supply regime shift or the failure of Iran’s toll scheme to generate any alternative revenue.
FAQ
What exactly changes on April 20?
The last commercial tanker that exited the Strait of Hormuz before the blockade departed on February 28. JPMorgan calculated that accounting for 14-to-18-day transit times to Asian ports and a standard 30-to-40-day refinery draw cycle, the cargo from that final voyage would be consumed by approximately April 20. After that date, global refineries are drawing exclusively from inventories and non-Hormuz supply — a fundamentally different market regime. No new Hormuz-origin crude is entering the system.
Why is the futures price so much lower than the physical price?
Brent futures at $98 per barrel price a probability-weighted average of scenarios over several months of forward delivery — including the possibility of a ceasefire, Hormuz reopening, or demand destruction reducing consumption. Dated Brent at $131 to $133 prices the barrel a refinery can physically load onto a tanker within the next 10 to 30 days. The $35 to $38 gap reflects the difference between what traders think might happen and what is actually happening at refineries, terminals, and ports. Morgan Stanley described the disconnect as “a much more violent shock in physical Brent-linked barrels.”
Can Saudi Arabia compensate for the Hormuz shortfall?
Not at current infrastructure capacity. The East-West Pipeline to Yanbu has 7 mb/d of throughput capacity, but Yanbu port’s effective loading ceiling is approximately 4 mb/d — and the March average was just 2.6 mb/d. The result is 2.5 to 3 mb/d of crude sitting in tanks on the Red Sea coast. Combined with Khurais offline and other production losses, Saudi exports run 4 to 5 mb/d below pre-war levels. The kingdom is pumping below its own OPEC+ quota by nearly 3 mb/d — not by choice, but by physical constraint.
What does China’s 120-day oil buffer mean for US pressure?
China holds enough crude in strategic and commercial reserves to cover approximately 120 days of net imports, according to Windward data. That buffer insulates Beijing from near-term American coercive pressure and reduces China’s incentive to broker a Hormuz reopening on US terms. The 157.7 million barrels of Iranian crude currently at sea — 98 percent bound for Chinese ports — extends that buffer further. Washington’s most direct leverage is secondary sanctions on Chinese banks and refiners, not supply denial.
What happens if the ceasefire expires on April 22 without renewal?
The ceasefire’s expiry removes the framework — however ineffective — under which limited Hormuz transits occurred. Iran has already re-closed the Strait as of April 18 and rejected the second round of Pakistan-mediated talks. The Touska seizure hardened Tehran’s position further. Without a ceasefire extension, JPMorgan’s $150-per-barrel Brent scenario re-enters the forecast range. The Hajj pilgrimage season beginning April 18 raises the kinetic threshold for military action near Saudi Arabia, constraining both US and Iranian escalation options while doing nothing to resolve the underlying supply crisis.