
{“content”: “
REPLACED OK len: 67017
n
{“content”: “
n
{“content”: “
The Middle East briefing 3,000+ readers start their day with.
One email. Every weekday morning. Free.
n
n
n
n
n
n
n
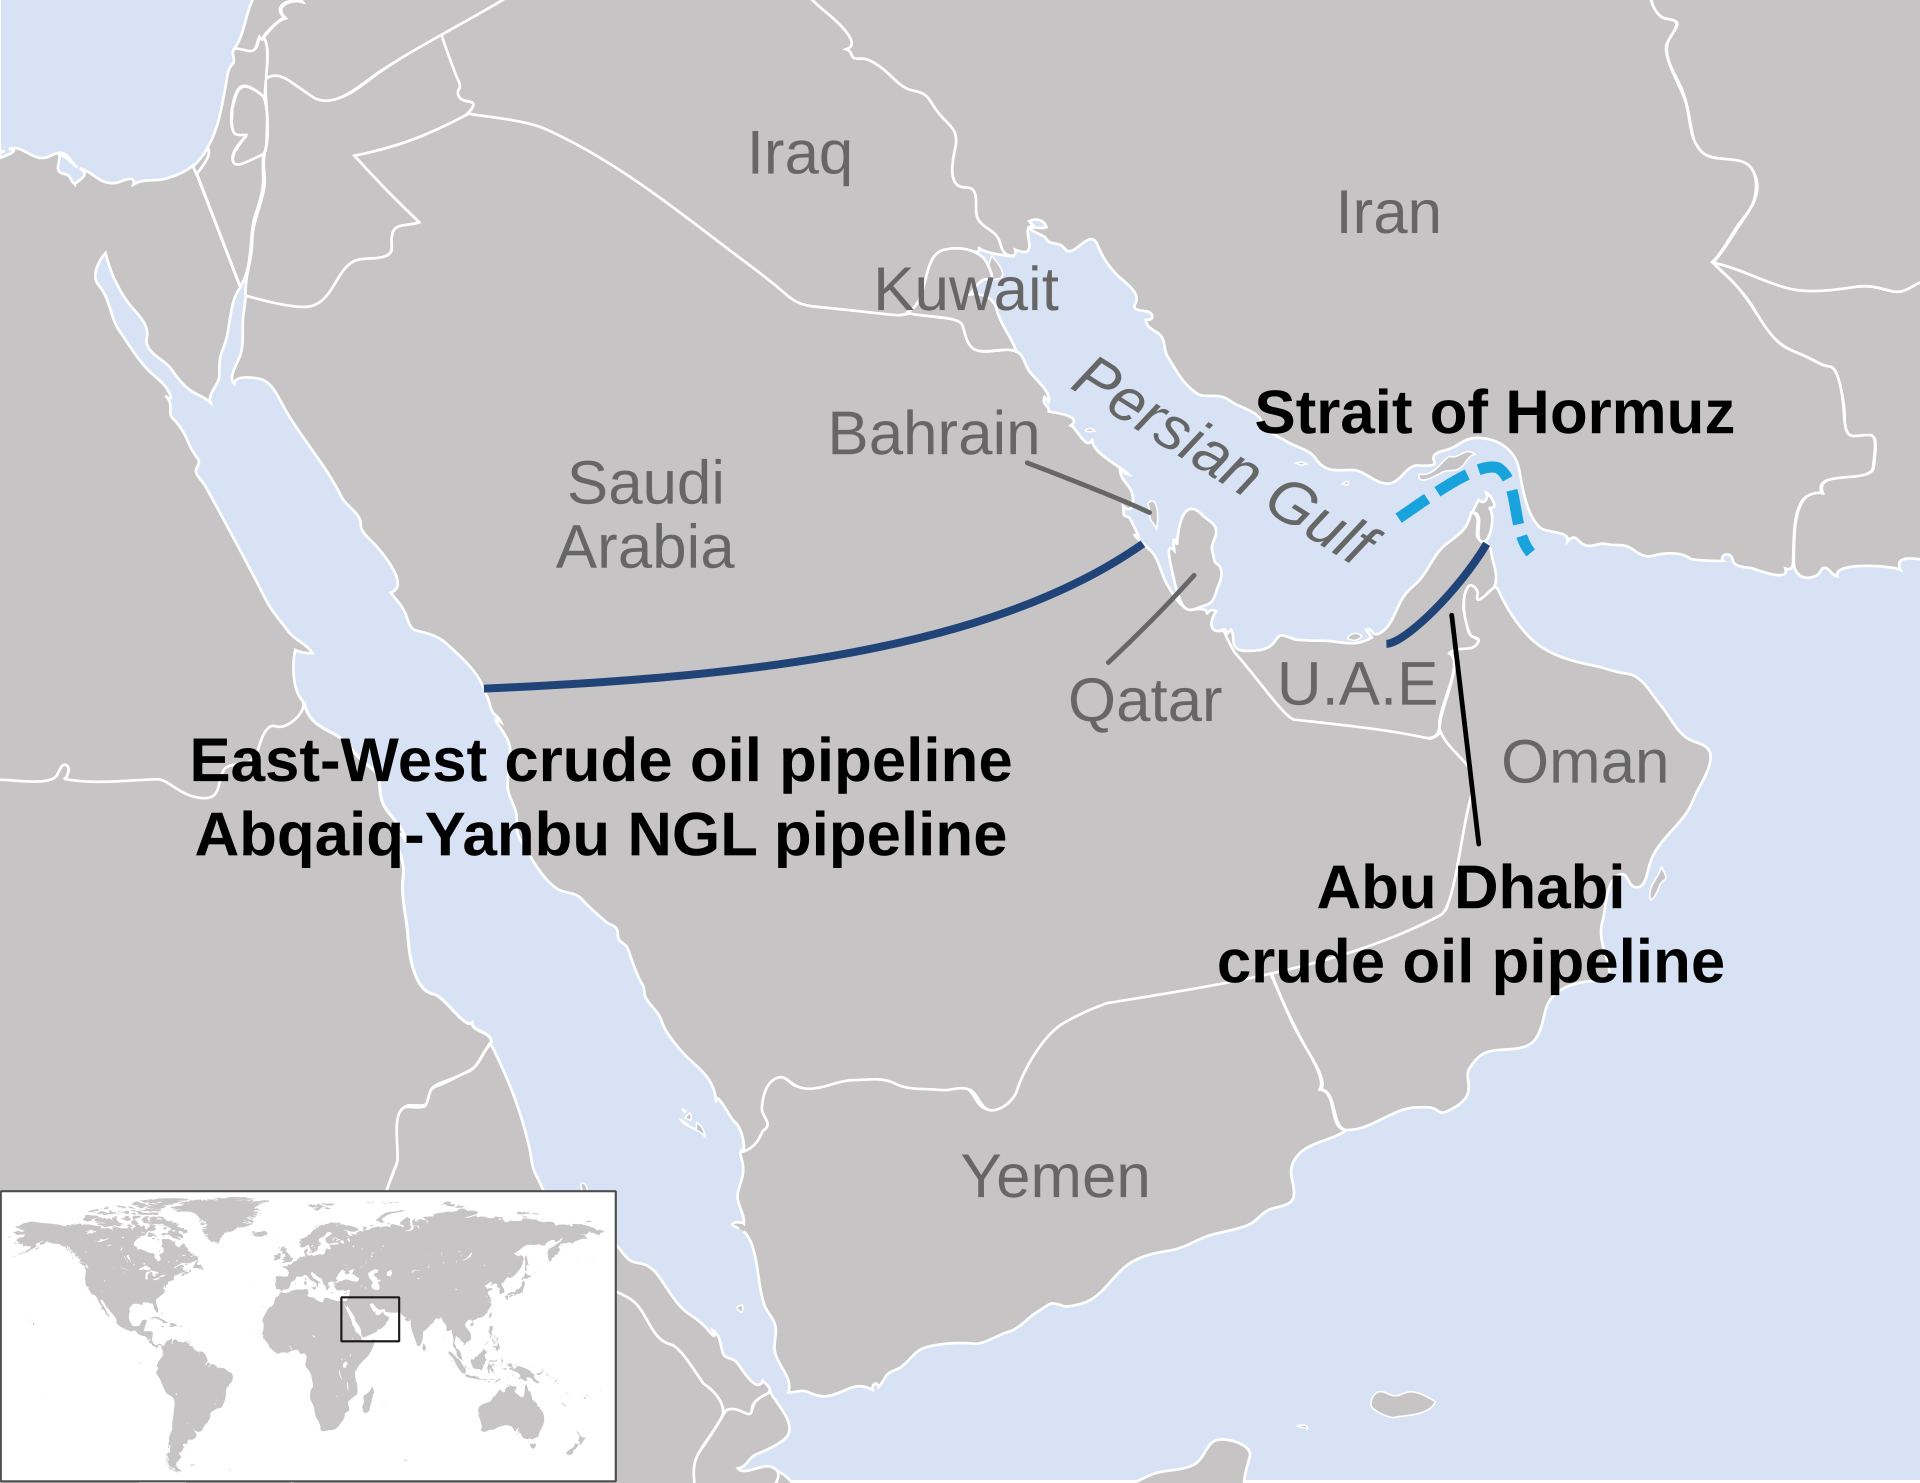
DHAHRAN u2014 Saudi Arabia lost 3.15 million barrels per day of crude production in a single month. The East-West Pipeline, restored to 7 million bpd capacity on April 12, carries whatever Aramco can produce to Yanbu. It does not produce oil. The pipeline is full. The fields are not.
n
n
n
n
n
n
n
n
n
n
n
n
n
n
n
Between February and March 2026, Saudi output fell from 10.4 million bpd to 7.25 million bpd u2014 a 30 percent collapse that the IEA called part of the “largest disruption on record” in global oil markets. The recovery narrative since April 12 has centered on the pipeline fix, as though routing was the only wound. It was not. Khurais remains offline with no restoration date. Yanbu’s loading berths cannot physically move 7 million bpd. And the OPEC+ quota of 10.2 million bpd now sits 3 million bpd above what Saudi Arabia can actually pump u2014 a number so far from reality that the quota has become decorative. An analysis of why Aramco’s “days to restart” claim contradicts the physical constraints at Khurais and Yanbu explains the gap between the market signal and the operational reality. Why OPEC+’s May quota vote compounded that credibility gap — and what three consecutive paper-barrel increases mean for the cartel’s post-war pricing authority — is the subject of OPEC+ voted to add 206,000 bpd. The market didn’t even blink.
n
n
n
n
n
n
n
n
n
n
n
n
n
n
n
n
n
n
n
n
n
n
Table of Contents
n
n
n
n
n
n
n
n
n
n
n
n
n
n
n
- n
- The 30 Percent Production Collapse
- What Does a Full Pipeline Actually Carry?
- The Khurais Gap Has No Timeline
- Why Can Yanbu Not Load 7 Million Barrels a Day?
- How Far Is Saudi Arabia From Its OPEC+ Quota?
- The Fiscal Arithmetic at 7.25 Million bpd
- Why the 2019 Abqaiq Recovery Does Not Apply
- The OSP Trap at Reduced Volume
- The Ceasefire Assumption Embedded in Every Forecast
n
n
n
n
n
n
n
- n
n
n
n
n
n
n
n
n
n
n
n
n
n
n
n
n
n
n
n
n
n
n
n
n
n
n
n
n
n
n
n
n
n
n
n
n
n
n
n
n
n
n
n
n
n
n
n
n
n
n
n
n
n
n
n
n
n
n
n
n
n
n
n
n
n
n
n
n
n
n
n
n
n
n
n
n
n
n
n
n
n
n
n
n
n
n
n
n
n
n
n
n
n
n
n
n
n
n
n
n
n
n
n
n
n
n
n
n
n
n
n
n
n
n
n
n
n
n
n
n
n
n
n
n
n
n
n
n
n
n
n
n
n
n
n
n
n
n
n
n
n
n
n
n
n
n
n
n
n
n
n
n
n
n
n
n
n
n
n
n
n
n
n
n
n
n
n
n
n
n
n
n
n
n
n
n
n
n
n
n
n
n
n
n
n
n
n
n
The 30 Percent Production Collapse
n
n
n
n
n
n
n
n
n
n
n
n
n
n
n
The IEA’s April 2026 Oil Market Report recorded global supply falling 10.1 million bpd to 97 million bpd in March. OPEC+ production dropped 9.4 million bpd to 42.4 million bpd month-on-month. Within that aggregate, Saudi Arabia accounted for roughly a third of the total OPEC+ loss.
n
n
n
n
n
n
n
n
n
n
n
n
n
n
n
The EIA’s April Short-Term Energy Outlook placed Saudi March production at approximately 7.76 million bpd, broadly consistent with the IEA’s 7.25 million bpd figure once methodological differences in condensate classification are accounted for. Both agencies agree on the direction and approximate scale: a loss of 3 million-plus barrels per day from a single producer in a single month.
n
n
n
n
n
n
n
n
n
n
n
n
n
n
n
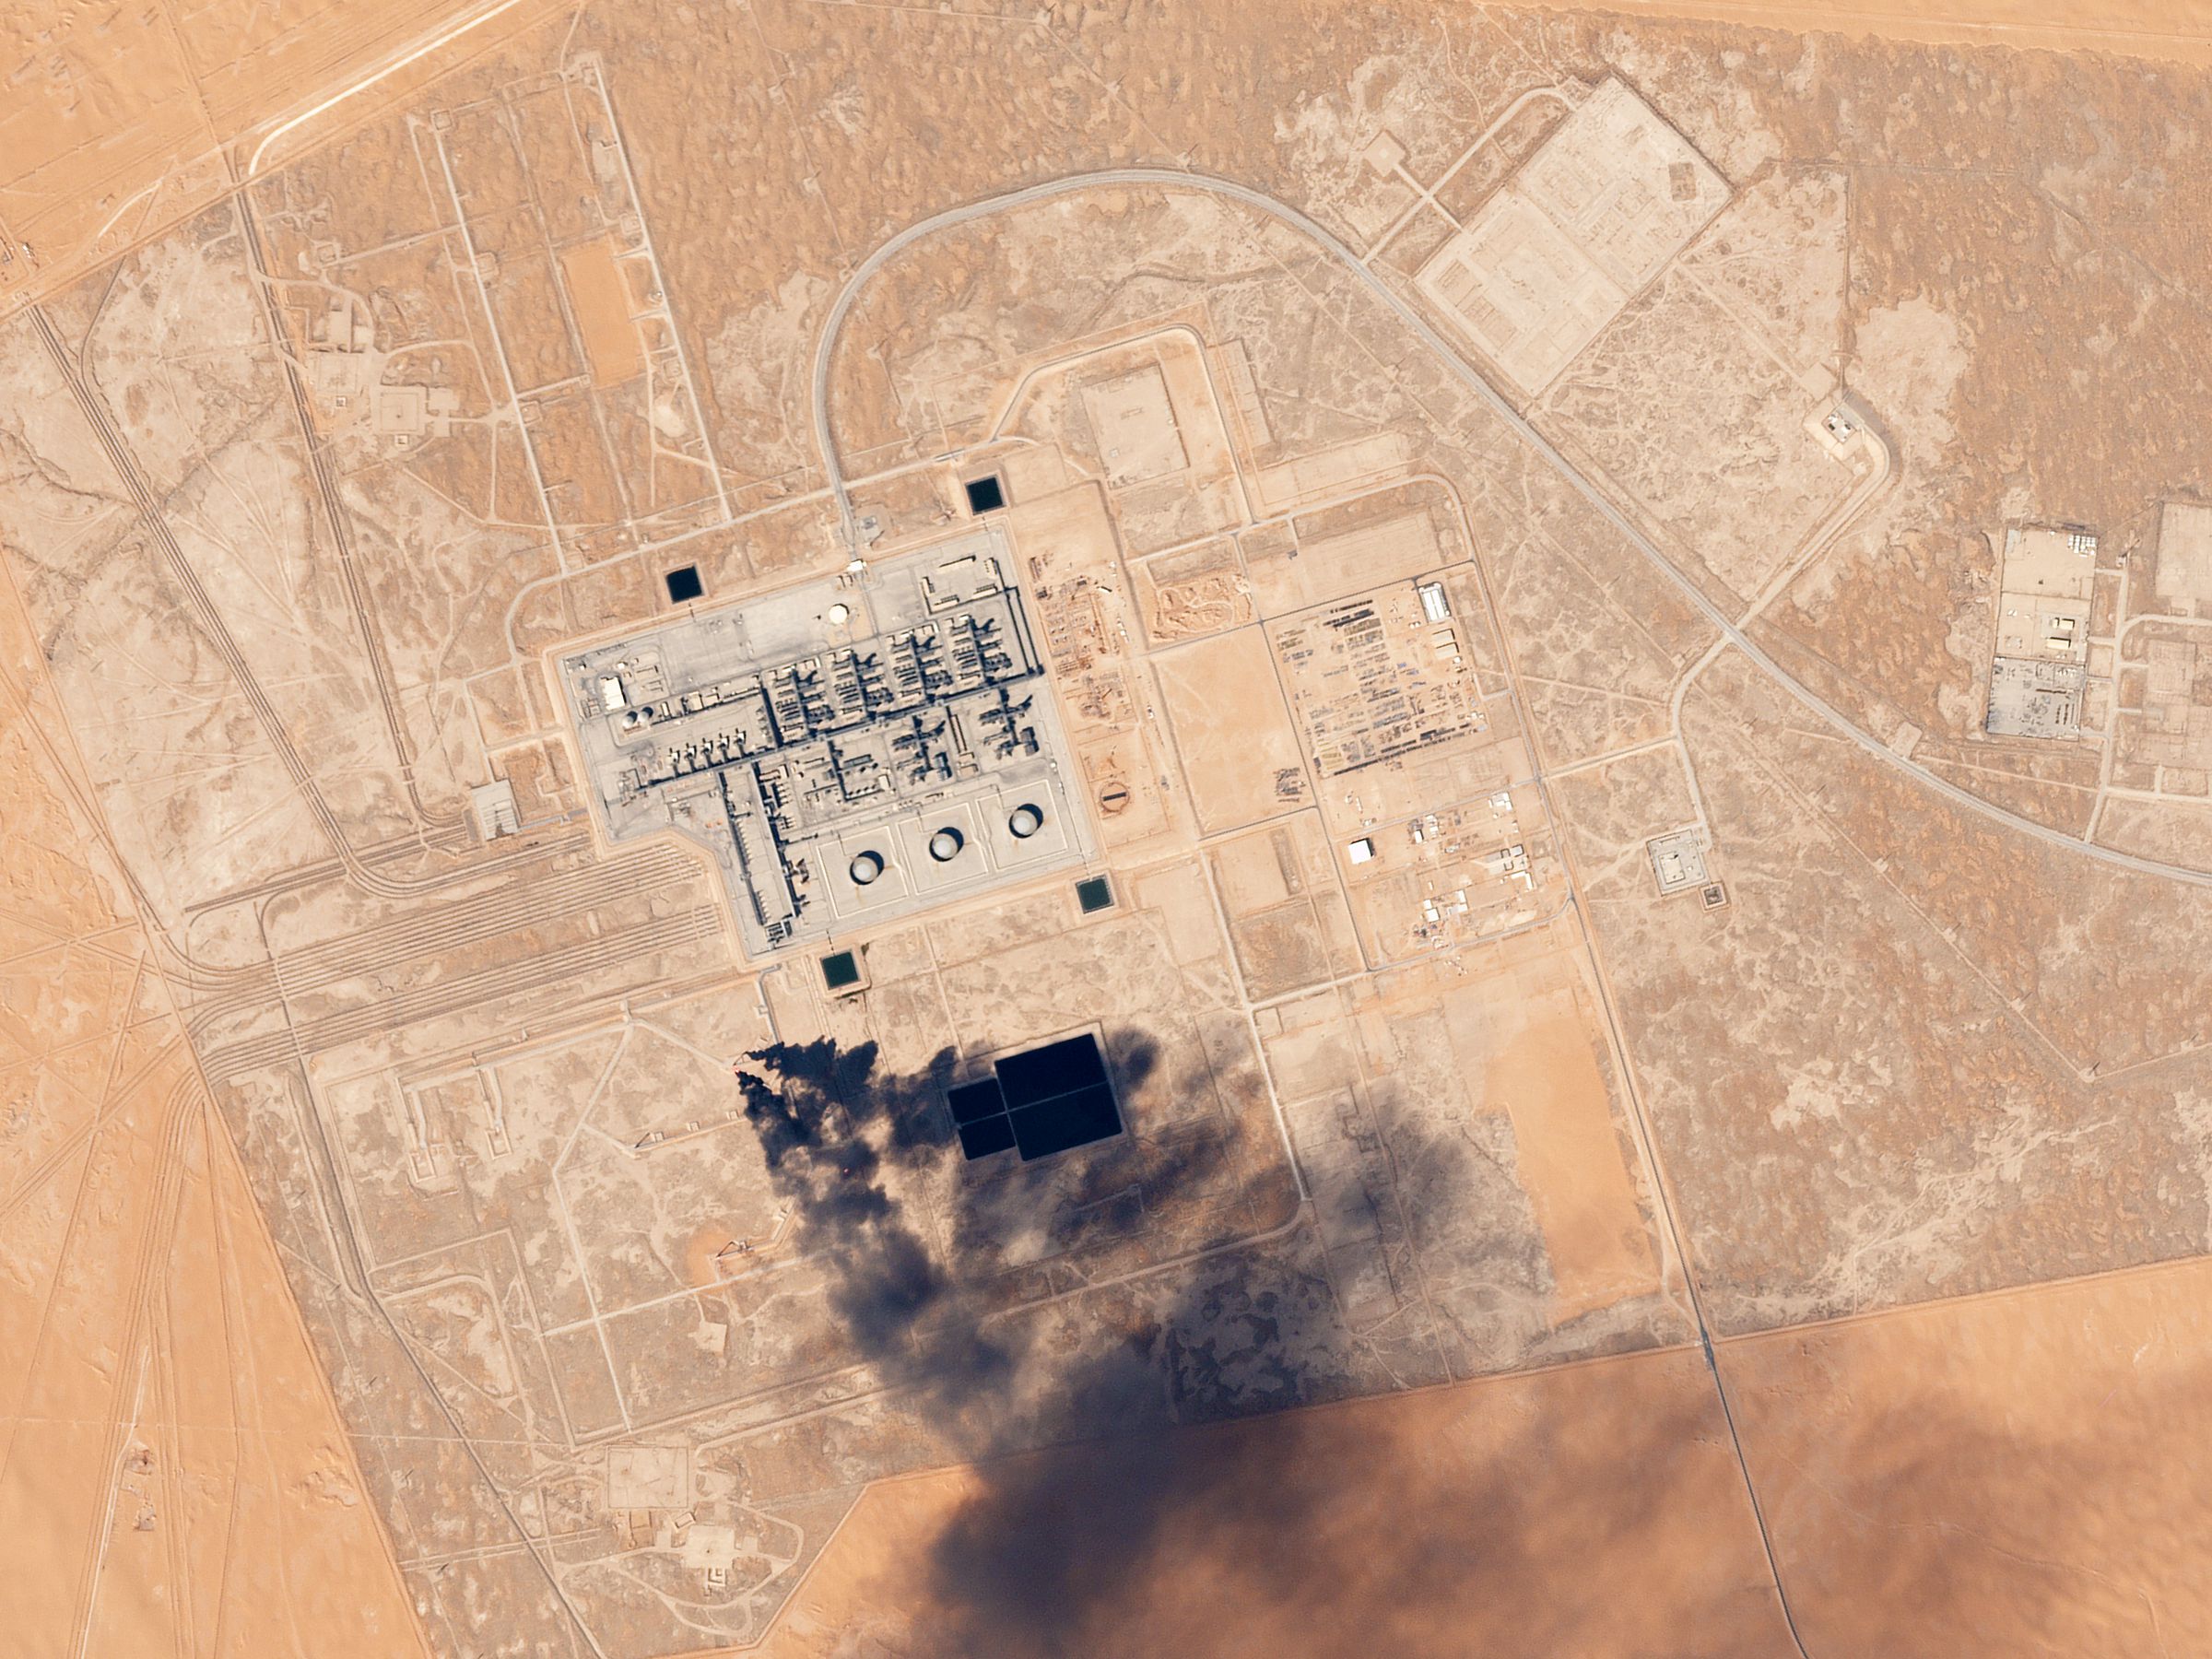
Saudi Aramco’s disclosure, issued through the Saudi Press Agency on April 9, attributed 1.3 million bpd of the loss to direct facility damage: 300,000 bpd at Khurais, 300,000 bpd at the Manifa offshore field, and 700,000 bpd in pipeline throughput from the pumping station strike. Manifa has since been restored. The pipeline was restored on April 12. Khurais has not.
n
That breakdown accounts for crude only. Absent from Aramco’s April 9 disclosure was any mention of the Juaymah NGL terminal in the Eastern Province, which had already been offline since February 23 — a separately suspended LPG export artery that compounds the crude export failure into a dual-artery shutdown with no historical precedent.
n
n
n
n
n
n
n
n
n
n
n
n
n
n
n
The remaining 2.5 million bpd u2014 the majority of the production drop u2014 came not from physical destruction of wells but from upstream curtailment. When export routes close and storage fills, wells are shut in. Bloomberg and CNBC, citing Saudi Energy Ministry data, confirmed on April 9 that the Hormuz closure had forced Aramco to throttle fields that had no route to market. The wells exist. The oil exists. The path to a tanker did not.
n
n
n
n
n
n
n
n
n
n
n
n
n
n
n
n
n
n
n
n
n
n
| Component | Volume Lost (bpd) | Status (April 17) |
|---|---|---|
| Hormuz routing blockade u2014 upstream curtailment | ~2,500,000 | Partially recovering (pipeline reroute to Yanbu) |
| East-West Pipeline pumping station | 700,000 | Restored April 12 |
| Manifa offshore field | 300,000 | Restored |
| Khurais oilfield | 300,000 | Offline u2014 no timeline |
| Total disclosed loss | ~3,150,000 | Partially restored |
n
n
n
n
n
n
n
n
n
n
n
n
n
n
n
n
n
n
n
n
n
n
n
n
n
n
n
n
n
n
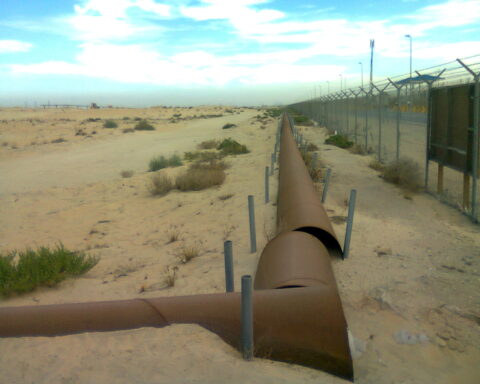
The pipeline restoration on April 12 addressed one constraint: the 700,000 bpd throughput reduction from the pumping station strike. It also reopened the primary alternative route to Yanbu for the 2.5 million bpd of shut-in production that needed somewhere to go. What it did not do was restore the 300,000 bpd of Khurais capacity that remains physically damaged, or expand the port infrastructure at Yanbu that must now handle volumes it was never designed to load at sustained rates above 5 million bpd.
n
n
n
n
n
n
n
n
n
n
n
n
n
n
n
What Does a Full Pipeline Actually Carry?
n
n
n
n
n
n
n
n
n
n
n
n
n
n
n
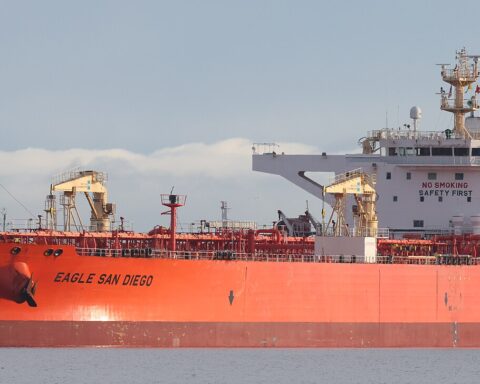
The East-West Pipeline u2014 formally the Petroline u2014 was built in 1981 as an insurance policy against exactly this scenario. Its nameplate capacity is 7 million bpd. Since April 12, it has been operating at that capacity, carrying Arab Light and Arab Extra Light grades 1,200 kilometers from Abqaiq in the Eastern Province to Yanbu on the Red Sea coast.
n
n
n
n
n
n
n
n
n
n
n
n
n
n
n
The framing in Reuters, The National, and Al Jazeera on April 12 treated the pipeline restoration as synonymous with export recovery. “Saudi Arabia restores East-West pipeline capacity” was the headline. The implicit message: the bypass works, the oil is flowing, the crisis is managed.
n
n
n
n
n
n
n
n
n
n
n
n
n
n
n
A pipeline is a pipe. It moves liquid from one end to another. At 7 million bpd capacity, it can carry 7 million bpd if 7 million bpd are fed into it. Saudi Arabia is not producing 7 million bpd of exportable crude for pipeline transit. Total production is 7.25 million bpd, of which roughly 2.5-3 million bpd is consumed domestically u2014 for refining, power generation, petrochemical feedstock, and domestic transportation fuel. The exportable surplus is approximately 4.5-5 million bpd.
n
n
n
n
n
n
n
n
n
n
n
n
n
n
n
The pipeline is not the bottleneck. The pipeline is the conduit that reveals two other bottlenecks: the production ceiling and the port ceiling.
n
n
n
n
n
n
n
n
n
n
n
n
n
n
n
The Khurais Gap Has No Timeline
n
n
n
n
n
n
n
n
n
n
n
n
n
n
n
Khurais is Saudi Arabia’s second-largest onshore oilfield, with a nameplate capacity of 1.2 million bpd after a 2009 expansion that cost $10 billion. The IRGC strikes in early April damaged wellhead infrastructure and surface facilities, taking 300,000 bpd offline u2014 roughly 25 percent of the field’s capacity.
n
n
n
n
n
n
n
n
n
n
n
n
n
n
n
Dr. Mohammad Al-Sabban, former adviser to the Saudi oil minister, told Asharq Al-Awsat on April 12 that Aramco “was able within a short period to restore affected refined products, repair faults, and resume operations efficiently.” He was describing the pipeline and Manifa. He was not describing Khurais.
n
n
n
n
n
n
n
n
n
n
n
n
n
n
n
Al Jazeera, in its April 12 coverage of the pipeline restoration, noted that the Khurais restoration “timeline pending announcement” u2014 a single clause buried in paragraph eleven of a story framed around recovery. No Saudi official, Aramco spokesperson, or Energy Ministry communication has provided a date for Khurais to return to pre-strike capacity.
n
n
n
n
n
n
n
n
n
n
n
n
n
n
n
The distinction matters because of what Khurais produces. The field’s output is predominantly Arab Light u2014 the benchmark grade for Asian term contracts, the grade against which the Official Selling Price is set, and the grade that Aramco told April term customers would be the sole variety shipped from Yanbu. Every barrel of Arab Light that Khurais does not produce is a barrel that Aramco cannot offer to the customers who are already receiving reduced allocations.
n
n
n
n
n
n
n
n
n
n
n
n
n
n
n
At 300,000 bpd, the Khurais gap is smaller than the pipeline or routing losses. But the pipeline loss was restored. The routing loss is being partially addressed through the Yanbu reroute. The Khurais loss is static. It is the only component of the 3.15 million bpd collapse for which Saudi Arabia has disclosed no recovery path.
n
n
n
n
n
n
n
n
n
n
n
n
n
n
n
n
n
n
n
n
n
n
n
n
n
n
n
n
n
n
Why Can Yanbu Not Load 7 Million Barrels a Day?
n
n
n
n
n
n
n
n
n
n
n
n
n
n
n
The Yanbu bottleneck is the structural constraint that the pipeline-restoration narrative obscures. A pipeline delivering 7 million bpd to a port that can load 4 to 5.9 million bpd creates a surplus at the terminus, not a solution at the destination.
n
n
n
n
n
n
n
n
n
n
n
n
n
n
n
Yanbu’s King Fahd Industrial Port has dedicated crude loading berths designed for approximately 4 million bpd of throughput u2014 VLCCs and Suezmaxes on fixed-berth rotations with tidal and draft constraints. Aramco has activated ancillary berths and ship-to-ship transfer operations that push the theoretical ceiling to 5.9 million bpd, according to Argus Media assessments of port utilization. Under optimal conditions u2014 no weather disruption, no queue congestion, no maintenance downtime on loading arms u2014 the port might sustain 5.9 million bpd. Under normal operating conditions, the practical sustained ceiling is lower.
n
n
n
n
n
n
n
n
n
n
n
n
n
n
n
Between the pipeline’s 7 million bpd capacity and the port’s 4-5.9 million bpd loading capacity, there is a structural gap of 1.1 to 3 million bpd. Crude arrives at Yanbu. It cannot all leave. The excess enters local storage, which fills. When storage fills, the pipeline must throttle. When the pipeline throttles, fields must curtail. The routing constraint that shut in 2.5 million bpd through the Hormuz blockade is partially replicated by the port constraint at Yanbu.
n
n
n
n
n
n
n
n
n
n
n
n
n
n
n
The IEA noted in its April OMR that Saudi Arabia and the UAE’s bypass exports combined “ramped up to a combined 5.7 mb/d.” That figure u2014 covering both countries’ Red Sea and Mediterranean pipeline routes u2014 is consistent with a Saudi Yanbu throughput of approximately 4-4.5 million bpd of crude exports, with the remainder being UAE volumes through the Habshan-Fujairah pipeline (ADCOP) and its Jebel Dhanna alternative.
n
n
n
n
n
n
n
n
n
n
n
n
n
n
n
Saudi crude exports to Asia fell 38.6 percent in March, from 7.108 million bpd to 4.355 million bpd, according to Kpler tracking data cited by Bloomberg. Aramco’s notification to April term customers u2014 Arab Light only, shipped exclusively from Yanbu u2014 confirmed the constraint was not a choice but a physical limitation. That physical ceiling also means that the Dated Brent physical price — which reached $148.87 on April 13 while ICE futures traded at $99.36 — cannot be fully captured by Aramco at constrained export volumes; the implications of that $49 spread for Saudi fiscal modelling are examined in Saudi Arabia’s Real Oil Price May Be $50 Above Every Fiscal Model.
n
n
n
n
n
n
n
n
n
n
n
n
n
n
n
Saudi Arabia solved the wrong chokepoint first u2014 or rather, solved the only chokepoint it could solve quickly. The pipeline is a 1981 asset that required repair, not construction. Yanbu’s port infrastructure would require years of expansion to match the pipeline’s throughput. That expansion was never undertaken because Yanbu was always the backup, not the primary export route. Before February 2026, approximately 80 percent of Saudi crude exports transited Hormuz through Ras Tanura and Ju’aymah terminals in the Eastern Province.
n
n
n
n
n
n
n
n
n
n
n
n
n
n
n
How Far Is Saudi Arabia From Its OPEC+ Quota?
n
n
n
n
n
n
n
n
n
n
n
n
n
n
n
At the April 5 OPEC+ meeting, the group agreed to a 206,000 bpd increase effective April 2026, setting Saudi Arabia’s production target at 10.2 million bpd. The decision followed the format of every recent OPEC+ meeting: calibrated increments, managed optics, coordinated messaging.
n
n
n
n
n
n
n
n
n
n
n
n
n
n
n
Saudi Arabia is producing 7.25 million bpd. The gap between quota and output is 2.95 million bpd u2014 29 percent of the target. For context, the typical OPEC+ compliance debate involves members producing 100,000 to 300,000 bpd above quota. Saudi Arabia is 3 million bpd below.
n
n
n
n
n
n
n
n
n
n
n
n
n
n
n
n
n
n
n
n
n
n
| Metric | Value | Source |
|---|---|---|
| OPEC+ April 2026 Saudi quota | 10.2M bpd | OPEC+ April 5 meeting |
| Actual March 2026 production | 7.25M bpd | IEA April OMR |
| Quota-production gap | 2.95M bpd | Derived |
| Gap as % of quota | 29% | Derived |
| February 2026 production | 10.4M bpd | IEA / EIA |
| Single-month production loss | ~3.15M bpd | IEA / EIA |
n
n
n
n
n
n
n
n
n
n
n
n
n
n
n
n
n
n
n
n
n
n
n
n
n
n
n
n
n
n
The quota is not a policy instrument when force majeure determines output. Saudi Arabia is not voluntarily withholding production to support prices; it is involuntarily unable to produce at target. The distinction matters for OPEC+ dynamics because other members u2014 the UAE, Iraq, Kazakhstan u2014 have spent years arguing for higher quotas on the basis that Saudi Arabia’s voluntarily constrained output was suppressing their own allocation. The argument assumed Saudi Arabia was choosing to underproduce. It is now not choosing.
n
n
n
n
n
n
n
n
n
n
n
n
n
n
n
The EIA’s April STEO projects GCC-wide shut-ins rising to 9.1 million bpd in April, up from 7.5 million bpd in March. If accurate, Saudi Arabia’s April production may fall further, widening the quota gap. The OPEC+ framework has no mechanism for a member state that wants to produce at quota but physically cannot.
n
n
n
n
n
n
n
n
n
n
n
n
n
n
n
For markets, the OPEC+ quota has historically served as a signal of intent u2014 the ceiling that constrains supply, supports price, and can be relaxed when the group wants to cool a rally. When the ceiling is 3 million bpd above production, it constrains nothing. The April 2026 quota is a statement about where Saudi Arabia would like to be, not where it is. The gap between those two numbers is the size of a mid-ranked OPEC member’s entire output.
n
n
n
n
n
n
n
n
n
n
n
n
n
n
n
n
n
n
n
n
n
n
n
n
n
n
n
n
n
n
The Fiscal Arithmetic at 7.25 Million bpd
n
n
n
n
n
n
n
n
n
n
n
n
n
n
n
Saudi Arabia’s fiscal position is governed by a simple relationship: the number of barrels produced, multiplied by the price received per barrel, minus the cost of everything else. The “everything else” has expanded enormously since 2019, when the last serious production disruption occurred. The PIF’s capital requirements, Vision 2030 construction commitments, a war, and a defense procurement surge have all increased expenditure. Vision 2030’s tenth-anniversary review puts that structural dependence in context: even with 93% of program KPIs on track, hydrocarbon revenues still fund 65–70% of the government budget. The structural retrenchment of Vision 2030 u2014 PIF slashing $41 billion in construction commitments, The Line formally suspended, and a 20% spending cut across portfolio companies u2014 all predated the first Iranian missile strike by months. The revenue side has now contracted. The downstream consequence extends beyond crude: Jubailu2019s 26 idle manufacturing units at Sadara Chemical represent Saudi Arabiau2019s first formal capital-markets quantification of that industrial war damage.
n
n
n
n
n
n
n
n
n
n
n
n
n
n
n
The IMF’s 2025 Article IV consultation established a central government fiscal break-even of $86.60 per barrel. Bloomberg Economics calculated a baseline break-even of $94 per barrel and a PIF-inclusive break-even of $111 per barrel. At $98 Brent u2014 roughly where the market sat on April 16 u2014 Saudi Arabia clears the IMF’s central government threshold by $11.40 per barrel but remains $13 below the PIF-inclusive break-even. The structural consequence of that persistent shortfall became explicit on April 15, when PIF formally reclassified NEOM as an “independent ecosystem” u2014 a designation that removes the megaproject from Vision 2030 KPI accountability: NEOM’s governance reclassification is a fiscal retreat dressed as a design decision.
n
n
n
n
n
n
n
n
n
n
n
n
n
n
n
The price tells half the story. The volume tells the other half. On April 29, when Brent reached $114.50, the two halves converged for the first time u2014 but Saudi Arabiau2019s war revenue paradox is that $300u2013500 million in daily war costs absorbed the entire crossover gain. The broader fiscal paradox u2014 where $114 oil sits simultaneously above the fiscal break-even floor and inside the World Banku2019s worst-case scenario band u2014 is examined in Why $114 Oil Is the Price Saudi Arabia Cannot Afford, which maps the structural constraints Iranu2019s bypass-elimination doctrine imposes on Saudi export capacity.
n
n
n
n
n
n
n
n
n
n
n
n
n
n
n
The IMF’s fiscal sensitivity analysis from the same Article IV consultation found that a 1 million bpd change in Saudi production corresponds to a 3.2 percent of GDP fiscal impact. At a sustained loss of 3 million bpd, the raw volume-driven fiscal deterioration is approximately 9.6 percent of GDP. The $18 per barrel price premium above pre-war budget assumptions offsets 2-3 percentage points. The net fiscal deterioration is 6-7 percent of GDP.
n
n
n
n
n
n
n
n
n
n
n
n
n
n
n
Farouk Soussa, Goldman Sachs’ MENA economist, projected a war-adjusted 2026 fiscal deficit of 6.6 percent of GDP u2014 approximately $73 billion, double the official 3.3 percent ($44 billion) forecast published in the December 2025 budget. Deutsche Bank and Emirates NBD cluster at 5.0-5.3 percent. None of these projections assumed a sustained production level as low as 7.25 million bpd; most were calibrated to an 8.5-9 million bpd scenario with partial Hormuz recovery. A further complication the projections did not model: the April PMI rebound to 51.5, which compounds rather than relieves fiscal pressure by expanding domestic subsidy and transfer obligations against the same capped export base — as analysed in Saudi Arabia’s Economy Is Recovering. That Is the Problem. The May 5 Q1 fiscal release confirmed those projections were too optimistic: SR125.7 billion in deficit consumed 76% of the SR165B full-year forecast in a single quarter.
n
n
n
Goldman’s April 27 note raised Q4 2026 Brent to $90 and confirmed a 9.6 million barrel-per-day global deficit — but that revision assumes Hormuz normalisation by end-June, a timeline that none of the active diplomatic channels can currently guarantee. At $90 Brent and 7.25 million bpd output, Goldman’s Q4 $90 forecast leaves Saudi Arabia $18 below its PIF-inclusive fiscal break-even, compounding the production-volume shortfall this article documents. The $47 spread between physical crude at $148.87 and Brent futures at $97 that opened on April 13 u2014 and what it reveals about Saudi Arabiau2019s revenue trap when record prices produce flat income u2014 is analysed in Physical Crude at $150 While Futures Say $97: The Marketu2019s Verdict on Hormuz Is Already In.
n
n
n
The full implications of Saudi Arabia’s production collapse for Vision 2030 — including why MBS published the programme’s best-ever KPIs into a wartime economy that those numbers cannot reflect — are examined in Vision 2030 Turned Ten the Same Week the Blockade Was Confirmed.
n
n
n
n
n
n
n
n
n
n
n
n
n
n
n
Annualized crude revenue at current rates u2014 7.25 million bpd at $98 Brent, with appropriate discounts for grade differentials and transport costs u2014 yields approximately $259 billion per year. Pre-war revenue at 10.4 million bpd and $80 Brent (the approximate pre-war baseline) was approximately $304 billion per year. The revenue gap is $45 billion annually, despite an $18 per barrel price increase. Higher prices did not compensate for lower volumes. They narrowed the gap. They did not close it.
n
n
n
n
n
n
n
n
n
n
n
n
n
n
n
Chatham House, in its March 2026 report on the war’s energy impact, described the dynamic precisely: Saudi Arabia’s fiscal position “reflects the compounding effect: higher prices that should generate surplus are offset by lower volumes, higher military costs, and a PIF capital structure built for $80 oil and peace.” The Vision 2030 implications of that compounding effect extend beyond the current production crash: as examined in what a frozen Hormuz conflict means for Saudi Arabia’s fiscal position, an indefinite volume constraint would structurally disqualify the diversification timeline that underpins the entire reform programme.
n
n
n
On April 22, as Brent crossed $101.91 on IRGC vessel seizures and Islamabad talks collapsed, the revenue arithmetic — $93 million per day below pre-war baseline despite a $22 per barrel price increase — is documented in Saudi Oil Revenue Falls $93 Million a Day Below Pre-War Baseline Despite Brent Crossing $101.
n
n
n
n
n
n
n
n
n
n
n
n
n
n
n
SAMA’s foreign reserves provide the buffer. They stood at approximately $451 billion in January 2026, falling to $434 billion in February u2014 a $17 billion single-month drawdown that predates the worst of the production collapse. If the February burn rate is representative of the wartime monthly drawdown, SAMA has approximately 24-26 months of reserves at current depletion. If the March-April burn rate accelerates u2014 as the production collapse, defense procurement surge, and PIF disbursements suggest it will u2014 the runway shortens.
n
n
n
n
n
n
n
n
n
n
n
n
n
n
n
n
n
n
n
n
n
n
| Fiscal Metric | Value | Source |
|---|---|---|
| Central govt break-even (oil price) | $86.60/bbl | IMF 2025 Article IV |
| PIF-inclusive break-even | $111/bbl | Bloomberg Economics |
| Current Brent (April 16) | ~$98.25/bbl | Market data |
| Goldman war-adjusted deficit | 6.6% GDP (~$73B) | Goldman Sachs / AGBI |
| Official deficit forecast | 3.3% GDP ($44B) | Saudi MOF Dec 2025 |
| SAMA reserves (Feb 2026) | ~$434B | SAMA / CEIC |
| Monthly reserve burn (Feb) | ~$17B | SAMA / Trading Economics |
| Annualized revenue at 7.25M bpd/$98 | ~$259B | Derived |
| Pre-war revenue at 10.4M bpd/$80 | ~$304B | Derived |
n
n
n
n
n
n
n
n
n
n
n
n
n
n
n
n
n
n
n
n
n
n
n
n
n
n
n
n
n
n
Why the 2019 Abqaiq Recovery Does Not Apply
n
n
n
n
n
n
n
n
n
n
n
n
n
n
n
The September 14, 2019 attack on Abqaiq and Khurais remains the single largest one-day oil supply disruption in history: 5.7 million bpd knocked offline in hours. Aramco restored full production in approximately two weeks. That recovery set the benchmark against which every subsequent Saudi production disruption is measured. It should not be.
n
n
n
n
n
n
n
n
n
n
n
n
n
n
n
The 2019 damage was concentrated at a single processing facility u2014 Abqaiq’s stabilization plant, which removes hydrogen sulfide and separates gas from crude before pipeline transport. The wells themselves were undamaged. The crude was in the ground, ready to flow. The processing bottleneck was fixed with replacement components from Aramco’s strategic spare parts inventory and emergency procurement from Honeywell and other OEMs. Hormuz was open. Eastern Province terminals at Ras Tanura and Ju’aymah were loading normally. Domestic storage absorbed interim volumes. Offshore spare capacity at Safaniyah and Manifa supplemented onshore recovery.
n
n
n
n
n
n
n
n
n
n
n
n
n
n
n
The 2026 damage profile differs on every dimension. Khurais has wellhead and surface facility damage u2014 not processing damage u2014 requiring field-level restoration that operates on a different timeline than component replacement. The Hormuz routing blockade, even with the pipeline bypass operational, funnels all exports through a port with lower loading capacity than the combined Eastern Province terminals. Domestic storage has been absorbing excess for weeks and is under pressure. Manifa, which provided surge capacity in 2019, was itself damaged and only recently restored.
n
n
n
n
n
n
n
n
n
n
n
n
n
n
n
n
n
n
n
n
n
n
| Dimension | 2019 (Abqaiq) | 2026 (Current) |
|---|---|---|
| Volume offline | 5.7M bpd | ~3.15M bpd |
| Damage type | Processing (single facility) | Wellhead + routing + processing |
| Hormuz status | Open | Blockaded (~2 transits/day vs 17-20) |
| Export route | Ras Tanura / Ju’aymah (full capacity) | Yanbu only (4-5.9M bpd ceiling) |
| Recovery timeline | ~2 weeks | Pipeline: 2 weeks. Khurais: unknown |
| Offshore spare capacity | Available (Manifa, Safaniyah) | Manifa was itself damaged |
| Storage buffer | Available | Under sustained pressure |
n
n
n
n
n
n
n
n
n
n
n
n
n
n
n
n
n
n
n
n
n
n
n
n
n
n
n
n
n
n
The two-week Abqaiq benchmark is the number that appears in every analyst note projecting Saudi recovery. Iran’s energy war has produced a different kind of disruption u2014 distributed, routing-dependent, and constrained by port infrastructure that cannot be expanded on an Abqaiq timeline. The recovery is not a function of Aramco’s engineering capability, which remains formidable. It is a function of Hormuz reopening, Yanbu expanding, and Khurais restarting. Only one of those is within Aramco’s direct control.
n
n
n
n
n
n
n
n
n
n
n
n
n
n
n
The OSP Trap at Reduced Volume
n
n
n
n
n
n
n
n
n
n
n
n
n
n
n
Aramco’s June Official Selling Price for Arab Light to Asia came in at +$3.50 per barrel above the Oman/Dubai average u2014 down 40 cents from the pre-war baseline, the first OSP reduction in three months. The contrast with May tells the fuller story: Saudi Arabia set the May OSP at +$19.50 per barrel in early April, when Hormuz closure and panic premiums briefly pushed Brent toward $109. June’s +$3.50 is not a 40-cent cut from May u2014 it is a pricing reset of $16 per barrel, reflecting a market in which the war premium has partially deflated but production has not recovered. Aramco is repricing into a reality where it can move fewer barrels and must decide whether to defend price or defend market share.
n
n
n
n
n
n
n
n
n
n
n
n
n
n
n
The June pricing crisis is a volume problem dressed as a pricing problem. At pre-war export levels of approximately 7 million bpd of crude exports, a $1 per barrel OSP adjustment costs Aramco roughly $210 million per month. At the current Yanbu-constrained export level of 4-4.5 million bpd, the same $1 adjustment costs $130-150 million per month. The reduced volume makes each dollar of OSP cut less expensive in absolute terms u2014 but each barrel more valuable.
n
n
n
n
n
n
n
n
n
n
n
n
n
n
n
The physical-futures gap compounds the problem. When Brent sits at $98 but the physical delivered cost of Saudi crude through Yanbu u2014 including war risk premiums, Suez transit costs for Red Sea cargoes, and longer shipping routes u2014 pushes the effective price $6-8 above Dubai benchmark, Asian buyers face a choice between Saudi term barrels at inflated effective costs and alternative spot cargoes from the UAE, Iraq, and the US at more competitive delivered prices.
n
n
n
n
n
n
n
n
n
n
n
n
n
n
n
Saudi crude shipments to China halved in May as the record OSP met a $91 spot market. China’s independent refiners u2014 the “teapots” of Shandong province u2014 do not buy term barrels at $19.50 premiums when Russian ESPO crude and Iraqi Basrah Medium are available at narrower differentials. The loss of Chinese teapot demand is not temporary price sensitivity; it is market share erosion that took Saudi Arabia five years to build after the 2020 price war.
n
n
n
n
n
n
n
n
n
n
n
n
n
n
n
The May 5 deadline for the June OSP decision carries an implicit question: does Aramco cut aggressively enough to retain Asian buyers at the cost of per-barrel revenue, or maintain pricing discipline and accept that Yanbu’s reduced volume will find fewer willing buyers? At 4.5 million bpd of exports, Saudi Arabia cannot afford to lose a single major buyer. At +$19.50, it is losing them.
n
n
n
n
n
n
n
n
n
n
n
n
n
n
n
The Ceasefire Assumption Embedded in Every Forecast
n
n
n
n
n
n
n
n
n
n
n
n
n
n
n
The April 8 ceasefire expires on April 22. Both Iran and the mediating parties have indicated “in principle” willingness to extend. Neither has formally confirmed terms. The IMF’s revised Saudi growth forecast of 3.1 percent for 2026 u2014 down 1.4 percentage points from January u2014 was published on April 15, before the ceasefire expiration date and before any extension was confirmed.
n
n
n
n
n
n
n
n
n
n
n
n
n
n
n
Every major projection u2014 Goldman’s 6.6 percent deficit, the IMF’s revised growth path, the EIA’s production trajectory, Bloomberg’s fiscal break-even band u2014 embeds an assumption about Hormuz. The assumptions vary: some model partial reopening by Q3, others assume bypass-only exports through year-end. None models a ceasefire collapse followed by renewed IRGC strikes on Saudi infrastructure. Adding to the fiscal pressure: OFAC General License U expired on April 19 without renewal, removing the sanctions waiver that had allowed shadow-fleet Iranian crude to clear at scale u2014 a factor that had been suppressing competing supply costs and partially anchoring global price floors. The IEA’s May 2026 Oil Market Report has since quantified how far the deficit now extends: global inventories are draining at 8.5 million barrels per day in Q2, with 250 million barrels already gone — a pace that no forecast built on a ceasefire assumption can survive intact.
n
n
n
n
n
n
n
n
n
n
n
n
n
n
n
Baker Hughes CFO Ahmed Moghal told Q1 investors the company is planning for Hormuz to remain closed through June and “possibly not fully operational until H2 2026” — the most explicit corporate timeline yet for when Saudi Eastern Province export volumes can realistically recover; the full capex and contract implications are examined in Baker Hughes Just Bet $33 Billion That Hormuz Won’t Reopen Before Summer. If the ceasefire holds and extends, the production recovery path is constrained but plausible: Khurais restoration at some unannounced date, gradual Yanbu throughput optimization, and eventual partial Hormuz reopening. If the ceasefire breaks, the baseline shifts. Yanbu itself is within range of Iranian ballistic missiles from western Iran u2014 a distance that the IRGC’s Khorramshahr-4 can cover. The pipeline pumping stations, struck once already on April 8, would be struck again. The three-sea doctrine articulated by IRGC commander Abdollahi explicitly identifies Saudi export infrastructure as a target set.
n
n
n
n
n
n
n
n
n
n
n
n
n
n
n
The 7.25 million bpd production floor is not the worst case. It is the current case under ceasefire conditions. The worst case is lower. The IRGC’s April 18 basin-wide targeting declaration u2014 which extends from Hormuz to the entire Persian Gulf and Sea of Oman, covering all three Saudi Gulf terminals u2014 formalized this risk, raising the question of whether the market is correctly pricing the difference between a chokepoint problem and a basin-wide problem, as examined in the April 19 analysis. With 96 hours to the April 22 expiry, this production floor is one of three simultaneous Saudi exposure vectors converging on the same deadline — alongside June OSP repricing and PAC-3 stockpile depletion at 14 percent of pre-war levels.
n
n
n
n
n
n
n
n
n
n
n
n
n
n
n
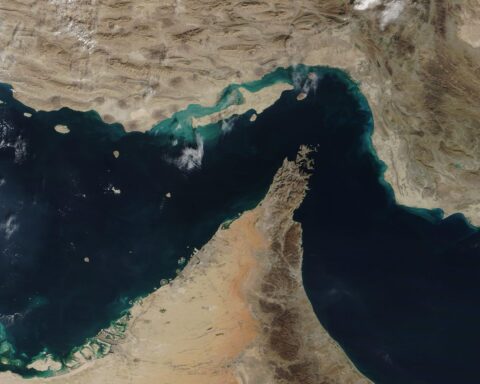
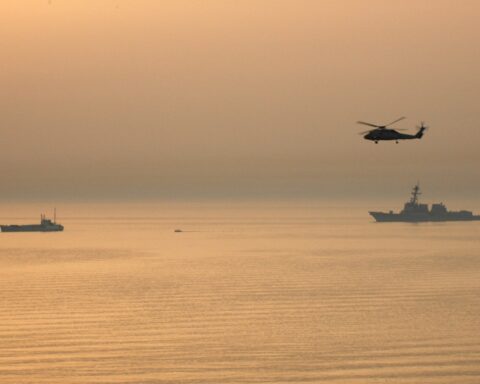
Hormuz transits on April 16 stood at 2 vessels, against a pre-war norm of 17-20. The US Navy blockade, in its fourth day, had turned back 10 ships. Brent closed at $98.25. The market has priced in a constrained Hormuz, a working pipeline, and a holding ceasefire. It has not priced in the production floor beneath the pipeline u2014 the 3 million bpd that is not flowing because of damage, not routing. By April 18, the mechanism enforcing that constraint had shifted: two dozen ships turned back at Hormuz as insurance underwriters and P&I clubs withdrew coverage, not as a result of any naval order.
n
n
n
n
n
n
n
n
n
n
n
n
n
n
n
n
n
n
n
n
n
n
n
n
n
n
n
n
n
n
The EIA’s price path assumes Saudi production gradually recovering to 9 million bpd by Q4 2026. That recovery requires three things to happen in sequence: the ceasefire must hold, Khurais must be restored, and either Hormuz must partially reopen or Yanbu must be expanded. The pipeline u2014 the thing that was fixed on April 12, the thing that generated the recovery headlines u2014 is the one component that is already working. It is the only component that is already working.
n
n
n
n
n
n
n
n
n
n
n
n
n
n
n
The production floor is the story. The pipeline is the pipe.
n
n
n
n
n
n
n
n
n
n
n
n
n
n
n
Frequently Asked Questions
n
n
n
n
n
n
n
n
n
n
n
n
n
n
n
What is Saudi Arabia’s current oil production capacity versus actual output?
n
n
n
n
n
n
n
n
n
n
n
n
n
n
n
Saudi Arabia’s sustainable production capacity is officially 12.5 million bpd, per Aramco’s 2023 disclosures to the Saudi stock exchange (Tadawul). Actual March 2026 output was 7.25 million bpd u2014 a utilization rate of 58 percent. The gap between capacity and output is not a spare capacity cushion available for deployment; it is stranded capacity that cannot reach export markets through the Yanbu bottleneck. Spare capacity is only meaningful when it can be produced, transported, and loaded onto a vessel. At present, the binding constraint is the port, not the reservoir.
n
n
n
n
n
n
n
n
n
n
n
n
n
n
n
How long could Saudi Arabia sustain production at 7.25 million bpd before fiscal reserves are exhausted?
n
n
n
n
n
n
n
n
n
n
n
n
n
n
n
At the February 2026 SAMA reserve drawdown rate of $17 billion per month, and with reserves at approximately $434 billion, the arithmetic yields roughly 25 months before reserves reach the $10 billion IMF-recommended floor. The drawdown rate is not linear. PIF disbursements for NEOM, Qiddiya, and Aramco-adjacent projects are contractually committed, defense procurement is accelerating, and the Saudi government issued $17.4 billion in international bonds in Q1 2026 to supplement revenue u2014 a pace that, if sustained, implies the Kingdom is already borrowing to cover the gap rather than relying solely on reserves.
n
n
n
n
n
n
n
n
n
n
n
n
n
n
n
Could Saudi Arabia expand Yanbu port capacity to match the pipeline?
n
n
n
n
n
n
n
n
n
n
n
n
n
n
n
Port expansion at Yanbu would require additional deep-water berths, VLCC-capable loading arms, tank farm expansion, and marine channel dredging. Comparable port expansion projects u2014 Ras Tanura’s 2014-2018 upgrades, Fujairah’s 2009-2012 terminal construction u2014 took 3-5 years from approval to first loading. Emergency wartime construction could compress timelines, but the Saudi Royal Commission for Yanbu has not announced any expansion program. The more immediate option is increased ship-to-ship transfers at anchorage, which Aramco has already activated but which introduce weather vulnerability and insurance cost premiums that erode the effective netback per barrel.
n
n
n
n
n
n
n
n
n
n
n
n
n
n
n
What happens to Asian refiners dependent on Saudi Arab Light if volumes remain constrained?
n
n
n
n
n
n
n
n
n
n
n
n
n
n
n
South Korea’s SK Innovation and Japan’s ENEOS Holdings are the most exposed, with Saudi crude comprising 30-35 percent of their refinery slates. Both have activated contingency supply agreements with the UAE (Murban crude via Fujairah) and the US (WTI Midland via the Corpus Christi terminal). India’s Reliance Industries, the world’s largest single-site refiner at Jamnagar, has pivoted toward Russian Urals and Iraqi Basrah Heavy. The grade substitution is technically feasible but not cost-neutral: Arab Light’s 32-33 API gravity and 1.8 percent sulfur content is optimized for Asian refinery configurations, and alternative grades require yield adjustments that reduce distillate output by 2-4 percent per barrel processed.
n
n
n
n
n
n
n
n
n
n
n
n
n
n
n
Has OPEC+ discussed adjusting Saudi Arabia’s quota to reflect actual production?
n
n
n
n
n
n
n
n
n
n
n
n
n
n
n
No formal quota adjustment has been discussed. The OPEC+ Joint Ministerial Monitoring Committee (JMMC) classified Saudi Arabia’s shortfall as force majeure at its March 28 extraordinary session u2014 a designation that exempts the Kingdom from compliance penalties but does not alter the headline quota. The political sensitivity is acute: reducing Saudi Arabia’s formal quota while the Kingdom is under military attack would be read in Riyadh as punishing the victim. The practical effect is that Saudi Arabia’s 10.2 million bpd quota exists as a placeholder for a production level it may not regain in 2026, inflating OPEC+’s nominal ceiling and distorting the supply-demand balance calculations that traders use to price futures.
n
n
n
n
n
n
n
n
n
n
n
n
n
n
n
The revenue consequences of that production shortfall became acute on April 17, when the Hormuz opening triggered an 11 percent Brent crash: Saudi oil revenue collapses as Brent crashes 11%, compressing Saudi fiscal arithmetic well below the kingdom’s break-even threshold.
n
n
n
n
n
n
n
n
n
n
n
n
n
n
n
South Korea’s procurement response to the Yanbu ceiling illustrates the market-share damage that outlasts any ceasefire: of the 273 million barrels Seoul secured outside Hormuz, 91 per cent are Saudi crude rerouted through Yanbu, with the remaining 9 per cent representing permanent diversification that Riyadh cannot reverse once supply chains are established.
n
n
n
n
n
n
n
“}
n
n
n
n
n
n
n
South Korea’s procurement response to the Yanbu ceiling illustrates the market-share damage that outlasts any ceasefire: of the 273 million barrels Seoul secured outside Hormuz, 91 per cent are Saudi crude rerouted through Yanbu, with the remaining 9 per cent representing permanent diversification that Riyadh cannot reverse once supply chains are established.
n
n
n
n
n
n
n
When IRGC gunboats fired on the Sanmar Herald on April 18, Brent jumped to $99.36 u2014 but the Yanbu ceiling ensures that Saudi Arabia’s fiscal paradox deepens even as oil prices recover, with the $63 billion in stranded Yanbu revenue cancelling out the gains from higher prices.
n
n
n
n
n
n
n
The physical reality behind that fiscal arithmetic crystallises today: JPMorganwith the $63 billion in stranded Yanbu revenue cancelling out the gains from higher prices.
n
n
n
n
n
n
n
#8217;s April 20 supply exhaustion calculation confirms that the last barrel loaded before the Hormuz closure has now reached its destination, meaning every refinery draw from this point forward depletes stockpiles that the 3.15 million bpd production shortfall cannot replenish.
n
n
n
n
n
n
n
The broader implication u2014 that even a durable ceasefire cannot deliver a fiscal dividend at current Brent levels u2014 is examined in full in The Peace Dividend Saudi Arabia Cannot Collect, which sets out why $97 Brent still leaves Riyadh $11–14 below its $108 fiscal break-even and why Morgan Stanley’s October production restoration timeline means the fiscal trap persists well into Q4 2026.
n
n
n
n
n
n
n
The structural implications of that fiscal gap are examined further in Trump’s $200 Oil and the War America Considers Cheap, which shows how the ceasefire’s $105-per-barrel suppressed price surplus flows almost entirely to US producers and refiners, not to Riyadh.
n
n
n
n
n
n
n
Saudi Arabia’s strategic response to the production shortfall — accelerating a northern overland rail corridor to bypass both Hormuz and Bab el-Mandeb — is examined in The Hejaz Railway Reversed: Saudi Arabia’s Northern Rail Corridor as Wartime Chokepoint Bypass. The dual-chokepoint pressure intensified on April 26 with reports that Iran is helping the Houthis build a Bab el-Mandeb toll mechanism modelled on the Hormuz fee architecture, threatening the Red Sea corridor that Yanbu depends on for export access. Houthi forces confirmed the threat operationally the same day with a dual-vessel ASBM strike off Mokha u2014 two missiles into an Aframax tanker 15 nautical miles from Mokha u2014 putting a 67 percent hit rate behind the toll architecture’s enforcement threat. How Ghalibaf’s “BEM unplayed” equation and Trump’s long blockade directive together close Saudi Arabia’s dual-chokepoint trap — trapping Saudi crude between Hormuz and Bab el-Mandeb simultaneously — is examined in full.
n
n
n
n
n
n
n
The fiscal exposure this production shortfall creates for Hajj security — with PAC-3 stocks at 14 percent of pre-war levels and the ceasefire expired — is examined in The Hajj Opens Under an Expired Ceasefire: MBS’s Custodian Title Becomes a Trap.
n
n
n
n
n
n
n
The engineering timeline underpinning Saudi Arabia’s fiscal horizon—Pentagon’s classified estimate that Hormuz mine clearance will take up to six months after hostilities end, with October 2026 as the earliest realistic date for resumed full-throughput exports—is analyzed in The Six-Month Sentence: How the Hormuz Mine-Clearing Timeline Defines Saudi Arabia’s Fiscal Horizon.
n
n
n
n
n
n
n
How Aramco’s IPO architecture allows the company to forecast a 57% quarterly profit surge even as the 3.15 million bpd production collapse drains Saudi state coffers is examined in The Profits Saudi Arabia Cannot Celebrate.
n
n
n
The gap between Saudi export promises and physical delivery capacity became explicit when Japan PM Takaichi called MBS directly to request increased crude supply u2014 a request the Yanbu terminal ceiling structurally cannot fulfil regardless of what Saudi Arabia agrees to diplomatically.
n
n
n
The structural bypass gap documented here — Yanbu’s 4–5.9M bpd ceiling against 7M bpd of pre-war Hormuz throughput — becomes permanent fiscal exposure once Trump removed any deadline for resolution: “Don’t Rush Me” — Trump Converts Saudi Arabia’s Short War Into an Open-Ended Fiscal Emergency quantifies the kingdom’s daily loss rate and the borrowing architecture now under open-ended stress. The earnings dimension of this arithmetic — how Aramco’s Q1 2026 profit surges 57% even as the production base craters — is examined in Aramco’s Q1 2026 Profit Paradox: A 57% Surge Built on 30% Less Oil.
n
n
n
Aramco’s pricing response to the production collapse — cutting the Arab Light OSP by $0.40 per barrel for July while operating 23% below February output — is documented in Aramco Cuts Arab Light OSP for Asia for First Time in Three Months.
n
n
n
The corollary of the Saudi spare capacity shortfall is now visible on the Iranian side: as documented in Iranu2019s Oil Storage Just Hit the Wall, Kharg Islandu2019s onshore storage reached capacity on April 26, forcing Tehran to begin shutting in wells whose pressure may not fully recover. The 300,000u2013500,000 bpd of permanent Iranian production loss that results means the global supply gap this bypass analysis identifies is wider and longer than current OPEC+ quota arithmetic acknowledges.
n
n
n
The structural consequence of the production collapse — how the 3.15 million bpd drop transferred swing-producer leverage from Riyadh to US shale operators sitting on $45–53 per barrel margins — is examined in Saudi Arabia Lost Its Swing-Producer Crown to a War It Wanted, which documents why the conditions that made Saudi Arabia the marginal supplier for half a century have been permanently disqualified. The OPEC dimension of the same constraint — how the UAE exit now leaves Saudi Arabia as sole price anchor in a cartel it cannot operate from its current export ceiling — is the subject of Saudi Arabia Inherits an OPEC It Cannot Operate. The formal announcement of the UAE exit, its 59-year membership timeline, and Abu Dhabiu2019s ADNOC capacity numbers are covered in UAE Exits OPEC After 59 Years, Stripping Saudi Arabia of Its Last Enforcement Lever.
n
n
n
The structural constraint that prevents the production collapse from resolving through a diplomatic deal alone — Iran’s inability to locate mines it laid without a master chart, and the Pentagon’s six-month minimum clearance timeline even after a signed agreement — is the subject of Iran Cannot Find Its Own Hormuz Mines — and the US Has No Ships to Clear Them. The financial consequence of this structural timeline — how Aramco’s Q1 earnings record is built on pricing power that cannot survive restored supply — is analyzed in Aramco Q1 2026 Earnings: The War Quarter That Won’t Repeat.
n
n”}
n
The diplomatic dimension of Saudi Arabia’s production collapse — how the 3.15 million bpd shortfall failed to translate into a seat at the Beijing summit that will determine Hormuz’s future — is examined in Trump-Xi Beijing Summit: Saudi Arabia Frozen Out of the Hormuz Endgame.
n
The military dimension of that structural constraint shifted on May 14, when CENTCOM commander Admiral Brad Cooper told the Senate Armed Services Committee that more than 90 percent of Iran’s mine inventory had been destroyed through over 700 US airstrikes — reducing the engineering obstacle to reopening while leaving Saudi Arabia’s export ceiling structurally unchanged. Aramco CEO Amin Nasser, speaking to investors the same day, said the oil market would not normalize until 2027 if Hormuz remained disrupted past mid-June. Why those two statements do not resolve into a reopening timeline — and what the gap between them costs Saudi Arabia — is examined in Cooper Says 90 Percent of Iran’s Mines Destroyed. The Strait Remains Closed.
n”}