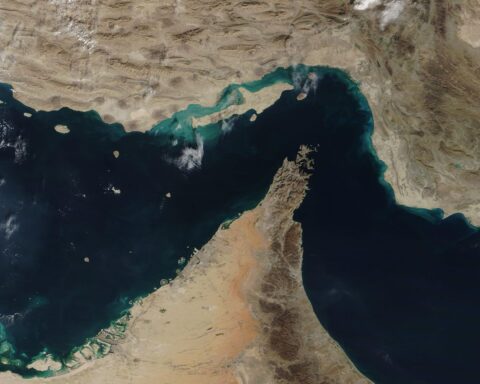
RIYADH — Fitch affirmed Saudi Arabia’s sovereign credit rating at A+ with a Stable Outlook on July 11 and, in the same report, forecast 2026 GDP growth of 0.6 percent — a figure nearly three times more pessimistic than the IMF’s 1.7 percent projection issued three days earlier. The affirmation and the forecast coexist in the same document because they measure different things: the A+ is backward-looking, built on $467.5 billion in central bank reserves, low non-performing loan ratios, and a debt-to-GDP trajectory below peer medians; the 0.6 percent is forward-looking, built on five months of Hormuz closure, collapsing export volumes, and an economy running $23 below Fitch’s own $94-per-barrel fiscal breakeven at current Brent prices.
Three days separate the two forecasts. The IMF’s 1.7 percent was itself a third consecutive downgrade — from 4.5 percent in January to 3.1 percent in April to 1.7 percent on July 8 — and yet Fitch’s 0.6 percent makes even that diminished figure look optimistic. The gap between them is 1.1 percentage points, representing roughly $25 to $30 billion in implied fiscal capacity. Riyadh will promote the A+; the 0.6 percent is the number that describes what happens next. By October, the IMF had moved well past both: its World Economic Outlook revised Saudi Arabia to a 3.3 percent contraction — a five-percentage-point swing from the July forecast in a single quarterly update.
Table of Contents
- What Did Fitch Actually Say About Saudi Arabia?
- How Does Fitch’s $87 Brent Assumption Survive the Market?
- Why Does Fitch Forecast 0.6 Percent and the IMF 1.7 Percent?
- Aramco’s Dividend Arithmetic at $71 Brent
- Can Saudi Arabia Fund Vision 2030 at 0.6 Percent Growth?
- The Borrowing Capacity That Already Ran Out
- What Does the PGSA August 18 Deadline Mean for the Second Half?
- The Rating Riyadh Will Publish and the Forecast It Will Not
- Frequently Asked Questions
What Did Fitch Actually Say About Saudi Arabia?
Fitch’s July 11 report affirms Saudi Arabia at A+ — the fifth-highest rung on its twenty-one-step scale — with a Stable Outlook, meaning no expected directional pressure toward upgrade or downgrade within the next twelve to eighteen months. The rating rests on accumulated buffers: $467.5 billion in SAMA foreign exchange reserves, a banking sector with a 19.2 percent Tier 1 capital ratio and a 1.1 percent non-performing loan ratio, and a projected 2028 debt-to-GDP ratio of 41.3 percent against a peer median of 58.1 percent. These are numbers that describe what Saudi Arabia built before the war, not what the war is doing to Saudi Arabia now.
The House of Saud Daily Briefing
Saudi Arabia's news in 3 minutes, every morning. Free. See today's issue
The same report forecasts 2026 GDP growth of 0.6 percent, projects the 2027 fiscal deficit widening to 4.7 percent of GDP even in a rebound scenario, and assumes Saudi oil production will average 9 million barrels per day for the full year — below 2025 levels, reflecting the Hormuz disruption. Fitch states that Iran’s nuclear program “will remain a source of tension” and assesses further US or Israeli military action against Iran as “quite likely.” On the non-oil economy, the agency projects that the loss of petrochemical exports during the strait closure will be “balanced out by stronger consumer spending and a recovery in business confidence” — a claim doing considerable work for a sentence inside a report that just halved the IMF’s growth figure.
Saudi oil exports to Asian markets fell 38.6 percent in the first quarter, according to Kpler tracking data. Sinopec — Aramco’s largest single Chinese buyer — cut monthly crude purchases from 10 million barrels to 2 million. Oil revenue fell 3 percent year-on-year in Q1 despite Brent averaging above $100 for most of the period, because the decline was entirely a volume collapse rather than a price one. Consumer spending and business confidence are being asked to compensate for the structural loss of the commodity that still generates more than 60 percent of government revenue.
| Metric | Fitch Assessment |
|---|---|
| Long-Term FC IDR | A+ (Stable Outlook) |
| 2026 GDP Growth | 0.6% |
| 2026 Oil Production Assumption | 9 million bpd (avg.) |
| 2026 Full-Year Brent Assumption | $87/bbl |
| Saudi Fiscal Breakeven | $94/bbl |
| 2027 Deficit Projection | 4.7% of GDP |
| 2028 Debt-to-GDP Projection | 41.3% (peer median: 58.1%) |
| Banking NPL Ratio | 1.1% |
| Banking Tier 1 Capital Ratio | 19.2% |
How Does Fitch’s $87 Brent Assumption Survive the Market?
Fitch’s rating report is built on a full-year 2026 Brent average of $87 per barrel, constructed from a specific price path: $100 to $110 during May through July, $80 in August, and $70 from September onward. The agency projects approximately 4 million barrels per day of excess supply flooding the market in the fourth quarter — driven by post-Hormuz Middle Eastern production recovery, non-OPEC supply growth, and potential higher OPEC output. Fitch characterizes the entire Hormuz episode as “a logistical supply shock rather than a permanent loss of production capacity,” framing the disruption as a temporary dislocation from which prices will overcorrect downward.
The arithmetic of the $87 average has already moved beyond Fitch’s control. With more than five months of the year elapsed and first-half prices tracking the $100-plus assumption, the remaining months must average at or near $70 to produce the full-year target — which is precisely what Fitch’s September price deck says will happen. Brent opened July 11 at $71.41. That figure sits $23 below Fitch’s own $94 fiscal breakeven for Saudi Arabia and $37 to $40 below Goldman Sachs’s consolidated breakeven of $108 to $111, which includes PIF obligations.
The paradox sits inside the rating report itself. The $87 annual average is the revenue figure that supports the A+ — it makes the full-year fiscal position look manageable when annualized. The $70 September-onward assumption is the forward environment that produces the 0.6 percent growth forecast — it describes an economy entering the second half with revenue per barrel below breakeven in every single month from September through December.
Both numbers are Fitch’s, published the same week. The A+ and the 0.6 percent are not contradictory; they are measuring different time horizons, and only one of those horizons is the one Saudi Arabia has to finance its way through.
Why Does Fitch Forecast 0.6 Percent and the IMF 1.7 Percent?
The 1.1-percentage-point gap between Fitch and the IMF is not a rounding difference — it represents two incompatible assessments of how quickly the Saudi economy recovers from Hormuz, and at what oil price. The IMF’s July 8 forecast of 1.7 percent assumes the strait begins reopening in mid-July, with conditions returning to prewar state by March 2027 and a 5.5 percent GDP rebound the following year. That model prices oil above Saudi breakeven for enough of the second half to partially offset first-half volume losses.
Fitch assumes five months of effective Hormuz closure with reopening by end of July — a timeline overlapping with the IMF’s by only two to six weeks. But Fitch models something the IMF does not: a post-reopening price collapse, with Brent falling from $80 in August to $70 by September as 4 million barrels per day of pent-up supply floods a market already contending with non-OPEC production growth and a Hormuz closure that failed to produce the expected war premium. The IMF assumes a gentler price transition; Fitch assumes a cliff.
| Variable | Fitch (July 11) | IMF (July 8) |
|---|---|---|
| 2026 GDP Growth | 0.6% | 1.7% |
| Hormuz Reopening Assumed | End of July | Mid-July |
| Post-Reopening Brent Path | $80 Aug → $70 Sep onward | Gradual normalization |
| Q4 2026 Oil Supply Balance | ~4 million bpd oversupply | Not specified |
| 2027 GDP Growth | Not published | 5.5% |
| Full-Year 2026 Brent Average | $87/bbl | Not published |
| Saudi Fiscal Breakeven | $94/bbl | $86.60/bbl (IMF) |
The difference between 1.7 percent and 0.6 percent is not about whether Hormuz reopens — both agencies expect it to — but about what happens to Saudi revenue when it does. Fitch’s model says reopening triggers oversupply, depressing Brent below breakeven for the entire second half and dragging non-oil recovery with it. The IMF’s model says reopening triggers a return to pre-disruption conditions. At $71.41 on the morning Fitch published its report, the market is tracking Fitch’s scenario, not the IMF’s.
Aramco’s Dividend Arithmetic at $71 Brent
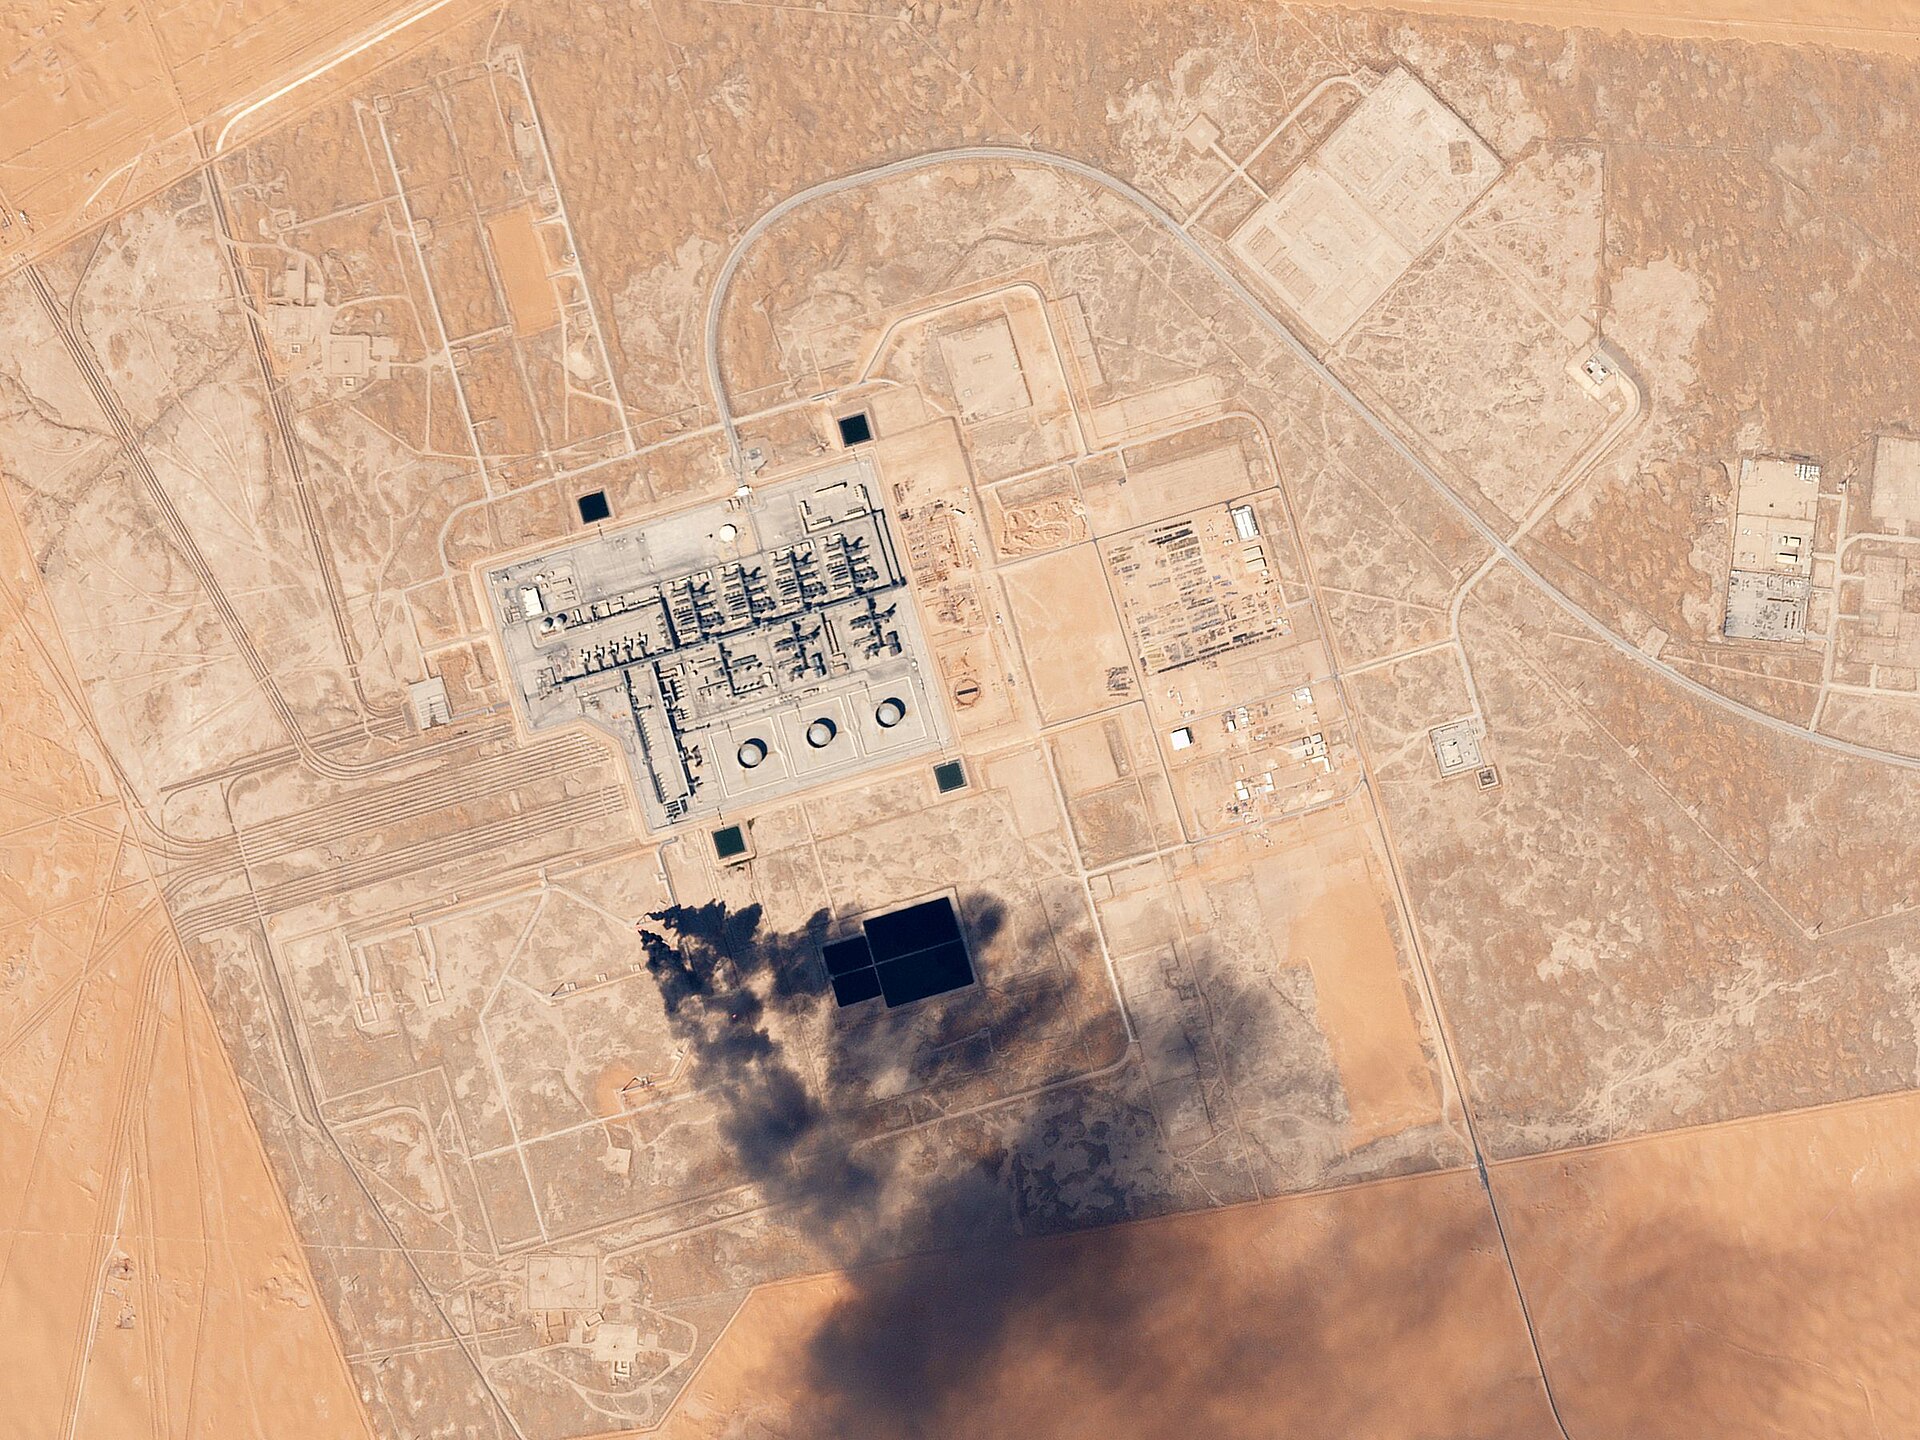
Saudi Arabia’s fiscal accounts run through Aramco. The Ministry of Finance holds 81.5 percent of the company’s shares and receives approximately $17.8 billion per quarter in dividends; the Public Investment Fund holds 16 percent and collects roughly $3.5 billion. Together, those dividend flows represent the single largest revenue line in the Saudi government’s budget — and at $71 Brent, the company generating them is already underwater on cash flow.
Aramco’s first-quarter 2026 free cash flow was $18.6 billion, against a quarterly base dividend obligation of $21.89 billion — a coverage ratio of 0.85x, meaning the company paid $3.3 billion more in dividends than it generated in free cash. CEO Amin Nasser characterized Q1 performance as reflecting “strong resilience and operational flexibility in a complex geopolitical environment.” The cash flow statement told a more direct story: Aramco went negative on a free-cash-flow-to-dividend basis for the first time since the pandemic-era collapse of 2020.
“Aramco is unlikely to be able to sustain its current dividend payout absent a strong rebound in oil revenue.”
— AGSI assessment, 2026
The annual base dividend commitment stands at $87.6 billion, with a 3.5 percent annual escalator that Aramco has shown no sign of suspending. After the June 9 payment, Aramco’s cash reserves fell to approximately $53.3 billion — the lowest post-dividend floor since pandemic-era borrowing. PIF’s quarterly Aramco receipt of $3.5 billion is now smaller, on a proportional basis, than PIF’s own annual coupon obligations on outstanding international bonds, which exceed $800 million per year and grow with each new issuance. The dividend that funds the sovereign wealth fund no longer covers the carrying cost of the sovereign wealth fund’s debt.
Can Saudi Arabia Fund Vision 2030 at 0.6 Percent Growth?
Fitch’s 0.6 percent growth figure lands on a fiscal position that was already overspent before the first quarter closed. Saudi Arabia’s Q1 2026 deficit was SAR 125.7 billion — $33.5 billion — consuming 76 percent of the government’s full-year SAR 165 billion ($44 billion) deficit target in 90 days. Goldman Sachs projects the full-year 2026 deficit at $80 to $90 billion, or 6 to 6.6 percent of GDP, nearly double the ceiling that the Ministry of Finance set in December 2025.
Public debt rose SAR 150 billion in Q1 alone, climbing from SAR 1.52 trillion to SAR 1.67 trillion — approximately $445 billion total. At that quarterly run rate, Saudi Arabia adds roughly $160 billion per year to its sovereign debt stack. Fitch projects the debt-to-GDP ratio reaching 41.3 percent by 2028, which the agency frames as comfortable because the peer median is 58.1 percent — but that framing assumes the denominator grows. At 0.6 percent headline growth, GDP barely moves, and the ratio rises faster than the model projects.
Vision 2030’s physical footprint is already contracting under the weight. PIF construction commitments fell from $71 billion to $30 billion — a 58 percent collapse — with NEOM alone carrying SAR 60 billion ($16 billion) in termination payments budgeted through 2030. That termination figure exceeds PIF’s entire liquid cash reserve, which had fallen to approximately $15 billion by late 2024 — before the war began — representing just 1.6 percent of PIF’s $912 billion in assets under management.
Kristian Coates Ulrichsen of the Baker Institute argued in his Arab Center DC assessment that the kingdom would be better positioned for the postwar period by shedding loss-making megaprojects and tying new investments directly to domestic economic priorities. The prescription amounts to managed retreat from the plan that was supposed to define the kingdom’s post-oil identity.
There is a demographic dimension to 0.6 percent that the Fitch report does not address but the budget must absorb. Saudi Arabia’s population grows at approximately 1.6 percent per year, driven by both natural increase and the expatriate labor force that Vision 2030’s construction pipeline was designed to attract. At 0.6 percent headline GDP growth, per-capita output shrinks — meaning the average Saudi resident is getting poorer in real terms while the credit rating says the state is sound. Fitch’s A+ reflects accumulated wealth; the 0.6 percent reflects the rate at which that wealth is being consumed.
The Borrowing Capacity That Already Ran Out
The National Debt Management Center — Saudi Arabia’s sovereign borrowing arm — declared its annual program “approximately 90 percent complete” before the first quarter ended. Total planned 2026 funding was SAR 217 billion ($57.8 billion). Residual borrowing capacity stands at approximately $5.8 billion. Goldman Sachs estimates the unfunded gap for the remainder of 2026 at $36 to $46 billion — the distance between what the kingdom has left to raise under its existing framework and what it will need to spend.
PIF has stepped into international bond markets to fill part of that gap. Its $7 billion issuance in May 2026 — the fund’s largest-ever single sale — was spread across three tranches: a three-year at +95 basis points over Treasuries, a seven-year at +105, and a thirty-year at +135. The deal attracted a $23.8 billion order book, 3.4 times oversubscribed, and total PIF international bond and sukuk issuance since January 2024 now exceeds $19 billion. Market appetite exists, but the pricing tells a story the order book does not.
PIF’s three-year spread of +95 basis points compares to +16 basis points for a comparable UAE sovereign credit instrument — a 79-basis-point gap that constitutes a measurable war-risk premium baked into every dollar PIF raises. PIF carries no explicit sovereign guarantee, but Fitch and Moody’s rate it at sovereign equivalent (A+ and Aa3 respectively) on a “virtually certain” state-support classification. A PIF default — which neither agency models as probable — would mechanically trigger a Saudi sovereign downgrade. The kingdom’s de facto sovereign borrowing has quietly migrated from the NDMC, which is tapped out, to PIF’s balance sheet, which is not.
“Second-quarter deficit could substantially exceed the first quarter’s $33.5 billion, and the cumulative deferral of Vision 2030 projects could reach a point at which the kingdom’s strategic narrative around economic transformation becomes politically unsustainable.”
— Arab Center DC, “Saudi Arabia’s Strategic Dilemma in the Iran War,” 2026
What Does the PGSA August 18 Deadline Mean for the Second Half?
Every fiscal projection in both the Fitch and IMF models assumes a post-reopening Hormuz that functions as it did before the war. The Persian Gulf Strait Authority — Iran’s toll-collection mechanism, constituted May 5 — introduces a variable neither model fully prices: a permanent per-barrel cost layer on Saudi exports through the strait, regardless of whether it is technically open. The PGSA charges approximately $1 per barrel via a cryptocurrency-denominated regime within Iranian territorial waters in the Qeshm-Larak corridor, and at Saudi Arabia’s pre-war Hormuz export volume of 5.5 million barrels per day, the implied annual cost to Saudi crude alone is approximately $2 billion.
The current fee suspension expires August 18 — 38 days from the Fitch report’s publication — with $253 million in accrued charges outstanding at $5.5 million per day. The mechanism is designed to remain operational regardless of the Iran-US MOU’s status, meaning that even a successful diplomatic resolution of the nuclear track does not automatically remove the toll infrastructure. Fitch’s report references the PGSA timeline without modeling it as a fiscal input, treating it as a geopolitical risk factor rather than a line item.
Iran’s wider fiscal warfare strategy exploits an asymmetry that Fitch’s $87 annual average obscures. Brent’s decline from above $100 in May to $71 in July damages Saudi revenue far more than Iranian revenue, because Iran’s effective realized price on dark-fleet exports has already been permanently discounted — Iranian crude sells at $8 to $12 below Brent regardless of headline price. Saudi netbacks are structurally tied to the spot market and to the OSP cuts Aramco has been forced to make since June. The $71 Brent that sits $23 below Saudi breakeven sits only $5 to $10 below Iran’s effective cost of sustaining exports at reduced volume.
The PGSA also penetrates the non-oil sectors that Fitch expects to carry recovery. Petrochemical exports, logistics chains, and marine transport — the sectors Vision 2030 was built to develop as diversification instruments against oil-price shocks — are all exposed to Hormuz toll risk on an ongoing basis. Fitch’s assumption that non-oil losses will be “balanced out” by consumer spending presumes those sectors can recover without paying a throughput fee that did not exist six months ago. If the PGSA persists, Iran will have done something the 2014-2016 oil crash could not: it will have turned Saudi Arabia’s non-oil diversification hedge into a second vector of fiscal exposure.
The Rating Riyadh Will Publish and the Forecast It Will Not
Fitch’s A+ will appear in PIF bond prospectuses, NDMC investor presentations, and Ministry of Finance press releases by the end of next week. It will be cited in quarterly earnings calls by Saudi-listed companies seeking to reassure foreign institutional investors, and it will be noted by Moody’s — which rates the kingdom one notch higher at Aa3 — as validation of its own decision to upgrade earlier in 2026. The three-agency matrix of Aa3, A+, and A from S&P gives Riyadh a consensus investment-grade floor that no wartime development has yet cracked.
The 0.6 percent will receive no such circulation. It is the lowest published growth estimate from any rated institutional forecaster for Saudi Arabia in 2026, and it implies a second half in which the economy functionally stagnates — growing at a rate that, adjusted for population increase, means per-capita GDP contracts. SAMA’s $467.5 billion in foreign exchange reserves represent approximately 5.5 months of import coverage, the tightest reserve adequacy ratio since the 2015-2016 oil price crash, when the kingdom burned through $116 billion in reserves in eighteen months and required emergency fiscal measures to stabilize the outflow.
Goldman Sachs economist Daan Struyven raised his Q4 2026 Brent target to $90 in what he called his fourth upward revision, citing “longer-than-expected shipping disruptions” and expecting normalization only by late 2026. If Struyven is right and Fitch is wrong about second-half oil prices, the A+ holds and the 0.6 percent proves too pessimistic. If Fitch is right — and Brent at $71 on the morning the report landed suggests the market currently shares the agency’s view — then Saudi Arabia enters August 2026 with a top-tier credit rating, near-zero growth, an exhausted borrowing program, and 38 days until the PGSA toll activates.
The A+ describes what the kingdom accumulated over the past decade. The 0.6 percent describes the rate at which it is spending the balance down.
Frequently Asked Questions
What is Saudi Arabia’s current credit rating across all three major agencies?
Saudi Arabia holds Aa3 from Moody’s (upgraded in early 2026, representing the highest rating the kingdom has ever received from any agency), A+ from Fitch (affirmed July 11, 2026 with a Stable Outlook), and A from S&P (affirmed, unchanged since 2024). The one-notch Moody’s-Fitch split means Moody’s has taken a structurally more optimistic view of Saudi creditworthiness than either peer — a divergence that predates the war but has widened since Moody’s chose to upgrade while Fitch and S&P held steady. The three-rating composite places the kingdom in the upper-investment-grade band, above China (A1/A+/A+) and below the UAE (Aa2/AA-/AA).
How does Fitch’s 0.6 percent compare to other 2026 Saudi GDP forecasts?
Fitch’s 0.6 percent is the lowest published estimate from any rated institutional forecaster. The IMF’s July 8 figure of 1.7 percent followed three consecutive downgrades from its January baseline of 4.5 percent. The World Bank’s most recent published estimate was 3.3 percent in April 2026 but has not been revised since the Hormuz closure was extended beyond initial projections. Goldman Sachs’s base case aligns closer to the IMF range, while the Saudi Ministry of Finance’s own 2026 budget assumed GDP growth consistent with the January IMF figure of 4.5 percent and the ministry has not published an updated internal estimate. By October, the IMF revised its Saudi 2026 projection to -3.3 percent — the IMF’s 3.3% contraction forecast for Saudi Arabia confirmed what both Fitch and Riyadh’s own finance ministry had signalled three months earlier.
What happens to Saudi fiscal accounts if Brent averages $70 through year-end?
At a sustained $70 average from July through December, Saudi Arabia’s full-year oil revenue would fall approximately $40 to $50 billion below the budget baseline that assumed Brent at $75 to $80, pushing the 2026 deficit above $90 billion — more than double the official SAR 165 billion ($44 billion) target. SAMA reserves would face drawdowns of $8 to $12 billion per month if current spending commitments are maintained, reducing the import coverage ratio from the current 5.5 months to under four months by year-end. At that level, Fitch’s Stable Outlook — which assumes reserve adequacy as a credit anchor — would face reassessment, and the A+ affirmation issued in July could become directionally stale within two quarters.
Does the A+ rating directly affect PIF’s borrowing costs?
PIF’s credit ratings are mechanically linked to the sovereign under Fitch and Moody’s “virtually certain” state-support frameworks, meaning any Saudi downgrade triggers a corresponding PIF downgrade within the same rating cycle. With over $19 billion in international bonds and sukuk outstanding since January 2024, a one-notch downgrade would reprice every tranche in the secondary market — widening spreads that already sit at +95 basis points for the three-year versus +16 for a comparable UAE instrument. The repricing risk is concentrated in the thirty-year tranche issued at +135 over Treasuries, which carries the longest duration exposure to any future rating action. PIF’s ability to access capital markets at current spreads depends entirely on the sovereign floor holding.
When was Saudi Arabia last downgraded by a credit rating agency?
All three agencies downgraded Saudi Arabia during the 2015-2016 oil price crash, when Brent fell below $30 per barrel and SAMA reserves declined by $116 billion over eighteen months. Fitch cut Saudi Arabia from AA to AA- in 2016; S&P lowered it from AA- to A+ (subsequently reduced further to A); Moody’s moved from Aa3 to A1 before upgrading back to Aa3 in 2026. The current environment shares the fiscal stress profile of that period — deficit overshoot, reserve drawdowns, dividend coverage gaps — but Brent at $71 remains more than double the 2016 trough, and Saudi Arabia’s banking sector ratios are substantially stronger than they were a decade ago.
The House of Saud Daily Briefing
Saudi Arabia's news in 3 minutes, every morning. Free. See today's issue