
RIYADH — Saudi Arabia’s Q1 2026 GDP release looks like vindication for Vision 2030: non-oil activity up 2.8% year-on-year while the oil sector buckles 7.2% sequentially under the Hormuz closure. Read the quarter-on-quarter line for private non-oil activity, however, and the number collapses to 0.2% — an 82% deceleration from the 1.1% quarterly average that ran through 2025, and the clearest signal yet that the diversification story is being held aloft by deficit spending that the budget can no longer sustain.
The General Authority for Statistics released the figures into a fiscal environment that is breaking in real time. A record SAR 125.7 billion quarterly deficit. Q1 spending up 20% year-on-year, the highest opening-quarter outlay in Saudi history, of which military expenditure alone climbed 26% and subsidies surged 170%. Both classifications sit inside government activities, which the GDP arithmetic counts as non-oil. Strip the state’s own cheque-writing out of the headline and the private engine — construction, retail, services — is already stalling before the fiscal adjustment that follows every Saudi oil shock has even been announced.
Table of Contents
- What does the Q1 2026 GDP release actually show?
- How is non-oil GDP being funded?
- Why is the private sector decelerating before the fiscal adjustment?
- The Oil Volume Trap: Profits Up, Receipts Down
- What does the 2014-16 precedent tell us about timing?
- The IMF Revision and the Goldman Deficit Estimate
- How is Tehran reading the numbers?
- The Sequencing Problem Riyadh Cannot Speed Up
- Frequently Asked Questions
What does the Q1 2026 GDP release actually show?
Saudi Arabia’s Q1 2026 GDP grew 2.8% year-on-year, according to GASTAT, driven primarily by non-oil activities. But the sequential reading tells a different story: real GDP contracted 1.5% quarter-on-quarter, oil output fell 7.2% QoQ, and private-sector non-oil growth decelerated to just 0.2% QoQ — an 82% slowdown from 2025’s quarterly average of 1.1%.
GASTAT’s Q1 2026 headline of 2.8% year-on-year growth was decomposed in the same release: non-oil activities contributed 1.7 percentage points, oil activities a surprising 0.7 percentage points, government activities 0.3 percentage points, and net taxes 0.2 percentage points. The oil contribution looks counter-intuitive given the production collapse, but the year-on-year comparison is to Q1 2025, when Brent averaged in the high-$70s and Saudi output was constrained by OPEC+ quota discipline. The Q1 2026 average price of roughly $107 carried the value comparison even as the volume comparison cratered.
The sequential figures tell a different story. Real GDP shrank 1.5% quarter-on-quarter on a seasonally adjusted basis, against an average quarterly expansion of 1.3% across the four quarters of 2025. Oil activities fell 7.2% QoQ versus a 2.6% average quarterly increase through last year — a swing driven by the closure-induced drop in Saudi exports to Asian markets, which AGSI puts at approximately 38.6% in the quarter. Production itself slid from roughly 10.9 million barrels a day in February to around 7 million in March.
The number that should occupy any honest reading of the release is buried below the headline. Non-oil GDP grew 0.2% QoQ. Government activities within that aggregate grew 0.8% QoQ — four times the rate of the private non-oil economy. The private sector, the engine the entire Vision 2030 model is built around, is now growing at one-fifth the pace it managed last year while the state is writing cheques at four times the private rate. The question for Q2 is whether the cheques can keep clearing.
The Middle East briefing 3,000+ readers start their day with.
One email. Every weekday morning. Free.
How is non-oil GDP being funded?
Saudi non-oil GDP is primarily funded by government spending, which flows from oil revenues. In Q1 2026, that circuit broke at its source: oil receipts fell 3% despite $107/bbl Brent, because the Hormuz volume collapse cut total government oil revenue. The resulting SAR 125.7 billion deficit — a record — is being financed by PIF bond issuance at wartime spreads.
PIF is simultaneously directing that borrowed capital toward a single concentrated bet: HUMAIN, its wholly owned AI subsidiary, has enlisted Goldman Sachs to raise SAR 20 billion (~$5.3 billion) in project financing for data centres and GPU capacity â the fundâs post-oil pivot distilled to its most defensible form while megaprojects and sporting ventures contract around it.
The mechanism behind the Saudi non-oil number is not a market mystery. Oil receipts enter the budget, the budget pays salaries and contractors and subsidies, those payments circulate through construction firms and retailers and service providers, and the resulting activity is recorded as non-oil GDP. There are three nodes in the circuit: oil revenue in, government spending out, private activity measured. Break the first node and the second must be financed elsewhere or the third begins to contract.
Q1 2026 is the quarter the first node broke. Government oil receipts fell to SAR 145 billion, down 3% year-on-year despite oil trading above $100 a barrel — a contradiction explained entirely by lost volume. Non-oil revenues rose 2% to SAR 116 billion. Combined, the revenue base grew at low single digits while spending grew at 20%. The result is SAR 125.7 billion of red ink in 90 days, the largest quarterly deficit on record, equivalent to 76% of the full-year deficit target spent in the first three months.
| Q1 2026 Saudi Fiscal Snapshot | Figure | YoY Change |
|---|---|---|
| Oil revenue | SAR 145B | -3% |
| Non-oil revenue | SAR 116B | +2% |
| Total revenue | SAR 261B | -1% |
| Total spending | SAR 387B | +20% |
| Military spending | SAR 64.7B | +26% |
| Subsidies | +170% | – |
| Quarterly deficit | SAR 125.7B | Record |
| % of full-year deficit target | 76% | in 90 days |
That deficit is being financed in part by PIF debt issuance at wartime spreads — the fund’s $7 billion bond sale in late May priced 79 basis points wide of Abu Dhabi sovereigns, a differential that did not exist in February. PIF’s bond raise drew a $23.8 billion order book at 3.4 times oversubscription, but the pricing tells the market’s view of Saudi sovereign risk more honestly than the headline take-up. Wartime spreads on sovereign-adjacent paper mean every additional riyal of deficit financing costs more than the last, even before the next bond comes to market.
And the spending surge is asymmetric. Military and subsidy outlays — the two fastest-growing line items in the quarter — flow narrowly: defence procurement contracts, fuel and food subsidies that compress household discretionary spend rather than expanding it. They do not commission new neighbourhoods or fund retail expansion. The composition of the Q1 spending boom is the worst possible mix for sustaining private-sector non-oil growth.
Why is the private sector decelerating before the fiscal adjustment?
Three independent indicators show private-sector stress arriving before any budget austerity: the S&P Global Saudi PMI fell to 48.8 in March 2026 — the first sub-50 contraction reading in 66 months — while FDI inflows dropped an estimated 60-70% year-on-year as Western capital halted deployments, and Q1 bankruptcy filings surged, concentrated in retail and construction.
The private sector is moving ahead of the budget. March 2026’s Saudi Arabia PMI from S&P Global and Riyad Bank printed at 48.8 — below the 50 expansion threshold for the first time in 66 months, the first contraction reading since early 2021. April recovered to 55.6 and May to 55.8, and the headline rebound has been used to dismiss the March figure as a one-off panic response to the closure. The March number is the more structurally significant signal precisely because it broke a five-and-a-half-year streak; subsequent recoveries on government order flow do not erase what the sub-50 print revealed about underlying demand.
Foreign direct investment is the cleaner indicator. AGSI and Capital Media estimates put Q1 2026 FDI inflows down 60-70% year-on-year, as European and American capital halted new deployment into Saudi projects pending visibility on Hormuz, Iran, and the fiscal path. That capital is the engine that was supposed to lift private non-oil GDP from its current dependence on state spending. Without it, every quarter of weaker private activity feeds back into a thinner pipeline of follow-on investment. The Q1 2026 GASTAT release now provides the first official baseline: gross FDI rose 2.4% to $7.1 billion, but net FDI fell as PIF outflows surged 50.6%, widening the gap to MISA’s $46 billion annual target — a structural divergence analysed in detail in Al-Saif’s $46 Billion FDI Target Runs Into PIF’s Own Outflows.
The Iran war has revealed a key threat to Saudi Arabia’s Vision 2030 strategy and plans for economic transformation.
Chatham House, “How the Iran war is reshaping Saudi strategy” (May 2026)
Bankruptcy filings tell the same story from the other end. Saudi Commercial Court data for Q1 2026, surfaced via PressTV, shows a sharp rise in insolvencies, roughly two-thirds concentrated in retail and construction — the two sectors most exposed to Vision 2030 project slowdowns and household belt-tightening. These are not multinationals with diversified balance sheets; they are domestic contractors and shop operators whose cash flow is government-payment-dependent, and whose failure rate is the most direct possible measure of stress in the non-oil engine.
Set against this, Saudi domestic tourism climbed 16% to 28.9 million arrivals — a number ministry communications have presented as a vote of confidence. Stimson Center analysis treats it more soberly: inbound arrivals fell roughly 35% on regional flight disruptions, and the domestic surge is partly a substitution effect from Saudis who would otherwise have travelled abroad. Tourism receipts that stay inside the kingdom are real, but they do not compensate for the foreign-currency-earning visitors who are not coming.
The Oil Volume Trap: Profits Up, Receipts Down
Aramco reported Q1 2026 net income of $33.6 billion, against $26.6 billion in Q1 2025 — a 26% surge that the company’s quarterly call presented as evidence of resilience. The Brent average of roughly $107 across the quarter more than compensated, at the headline level, for the volume losses imposed by the Hormuz closure.
Government oil receipts moved the opposite way. They fell 3% year-on-year to SAR 145 billion despite the price environment, because total revenue is the product of price and volume, and the volume term collapsed faster than the price term could compensate. OPEC+ assigned Saudi Arabia a 10.291 million barrel-a-day quota for the upcoming production cycle against actual deliverable output of around 7.76 million barrels a day — a 2.53 million barrel gap that is entirely undeliverable while the East-West Pipeline remains the only export route and Yanbu’s terminal complex caps throughput at 5 million.
The pipeline ceiling is the most important number in the Saudi oil ledger right now, and it is rarely cited in fiscal commentary. Aramco chief executive Amin Nasser told CNBC on May 11 that the oil market would normalise only in 2027 if Hormuz did not reopen within a few weeks, a horizon that ADNOC’s Sultan Al Jaber has independently echoed in more pessimistic form. The quarters between now and any such reopening are the quarters in which the gap between Aramco’s profit performance and the Saudi state’s revenue performance widens, because the state cannot capture price-driven upside on barrels it cannot move. The first break below $100 this month has brought Brent within $13.40 of the IMF’s $86.60 fiscal breakeven, reducing the Q1 $33.5 billion deficit from a shock to a trajectory.
That is the trap. Aramco shareholders can be paid out of a quarterly profit beat; a sovereign budget cannot be paid out of unrealised barrels. Every month the closure persists, the divergence between corporate earnings and state receipts compounds, and the deficit financing burden grows.
What does the 2014-16 precedent tell us about timing?
When oil prices collapsed in 2014, Saudi non-oil GDP did not follow for six to seven quarters — sustained by government spending until Riyadh imposed a 14% spending cut in late 2016. Non-oil GDP then decelerated two to four quarters after the fiscal adjustment. Applied to 2026, this precedent puts the non-oil trough in Q3-Q4 2026 — before it, the fiscal cushion holds; after it, it doesn’t.
Saudi non-oil GDP did not collapse in 2014 when Brent fell from $109 to its eventual $26.94 trough in January 2016. Growth held at 3.6% in 2014, 3.5% in 2015, and only printed 1.2% in 2016. The lag from price peak to GDP trough was six to seven quarters. The mechanism is on the public record: government spending was sustained through 2015 as a deliberate counter-cyclical buffer, contractor payments continued, and non-oil activity was carried by the cheque-clearing capacity of the state.
What broke the cushion was the fiscal adjustment. In late 2016 and early 2017, Riyadh imposed a 14% spending cut, reformed energy subsidies, and slowed payments to contractors. Non-oil GDP followed with a delay of two to four quarters from the fiscal turn. The construction and retail sectors — the same two now disproportionately represented in Q1 2026 bankruptcies — were the first to contract, because they sit closest to the government cheque in the payment chain.
The 2026 shock is structurally different and worse. The 2014 oil shock was a price collapse with unconstrained volume; Saudi Arabia could pump and sell, and the only question was at what price. The 2026 shock is a volume collapse with elevated prices: pumping capacity is intact, but the export route is partially closed, and no amount of price strength compensates for barrels that physically cannot reach Asian buyers. That removes the partial buffer that price recovery provided in 2016-17.
Run the precedent forward on its own timing. The shock hit Q1 2026. Fiscal adjustment has not yet been announced — Q1 spending was up 20% year-on-year. When the adjustment comes, whether through subsidy reform, deferred contractor payments, or formal budget revision, the 2014-16 lag suggests non-oil GDP deceleration begins two to four quarters later. That puts the trough somewhere in Q3 or Q4 2026, with private-sector non-oil potentially turning negative before year-end if the closure persists. The Q1 0.2% QoQ private non-oil reading is the leading indicator that the engine is already losing pressure before the budget has stopped feeding it fuel.
The IMF Revision and the Goldman Deficit Estimate
The IMF’s April 2026 World Economic Outlook revised Saudi Arabia’s 2026 GDP forecast from +4.5% to -1.4%, a 5.9 percentage point swing predicated on sustained Hormuz closure through the year. The pre-war IMF estimate of Saudi fiscal breakeven sat above $90 a barrel. The EIA’s May 2026 Short-Term Energy Outlook projects Brent to average $79 a barrel in 2027 as Middle East production normalises — a level below breakeven even in a peace scenario.
That projection compounds the problem in a way the Q1 numbers do not yet show. If the closure ends quickly, oil volume returns but at a price the EIA expects to be insufficient to balance the Saudi budget. If it does not end quickly, volume stays suppressed at elevated prices that may also be insufficient given the fiscal multiplier effects of a prolonged deficit-financing run. The recovery scenario is itself a trap because the market the closure created is more oversupplied than the market it disrupted.
Goldman Sachs models the full-year 2026 Saudi deficit at $80-90 billion, roughly 6.6% of GDP, against the official projection of 3.3%. Run the Q1 print of $33.5 billion forward at the same quarterly pace and the year lands at $134 billion — well past the Goldman top end. The official projection assumes a meaningful spending moderation in H2 that has not been announced, costed, or politically prepared. Defence spending up 26% in the quarter the kingdom hosted the Trump administration’s $142 billion arms package is not a line item that retreats quietly.
| 2026 Saudi Deficit Forecasts | Estimate | % of GDP |
|---|---|---|
| Official Saudi MoF projection | ~$40B | 3.3% |
| Goldman Sachs estimate | $80-90B | 6.6% |
| Q1 run-rate annualised | $134B | ~10% |
| IMF Saudi fiscal breakeven | >$90/bbl | – |
| EIA Brent 2027 forecast | $79/bbl | – |
That trio of numbers — IMF growth revision, Goldman deficit estimate, EIA price forecast — frames the budget arithmetic for the rest of 2026 more honestly than any GASTAT press release. The 2.8% YoY non-oil growth is the rear-view mirror reading. The IMF, Goldman, and EIA are looking through the windshield.
How is Tehran reading the numbers?
Iranian state media, led by PressTV, frames the Q1 2026 GASTAT data as confirmation that Vision 2030 is structurally broken — citing the record deficit, military spending surge, and mega-project terminations while ignoring the 2.8% non-oil YoY growth that would undercut the “freefall” narrative. Tehran attributes every riyal of Saudi red ink to the PGSA toll regime’s coercive effectiveness.
PressTV’s May 22 framing of the GASTAT release ran under the headline “Saudi Vision 2030 in freefall as fiscal woes from US-Israeli war on Iran deepens.” The Iranian state outlet does not engage with the 2.8% YoY non-oil growth, which would undercut the narrative; it focuses instead on the fiscal outputs: record deficit, military spending surge, subsidy explosion, mega-project terminations. Every riyal of red ink is attributed to Tehran’s pressure via the Persian Gulf Strait Authority toll regime that became operational on May 18.
Now, with the Iran war closing the Strait of Hormuz and oil exports down, the kingdom is bleeding revenue while its deficits grow. One by one, the mega projects are being scaled back, suspended, or quietly buried.
PressTV, May 22, 2026
The propaganda framing is overstated, but it is not factually wrong on the pieces it selects. NEOM has formally halted The Line until 2030 and beyond, redesignated Oxagon as priority node, and accumulated $8.45 billion in 2026 contractor terminations. The Webuild Connector high-speed rail link was terminated on May 27 with EUR 1.4 billion of work cancelled and EUR 1 billion of residual backlog written off. PIF exited LIV Golf at a $5.3 billion write-down while pivoting capital toward HUMAIN, the AI subsidiary that signed McKinsey and Accenture deals on May 20.
Tehran’s narrative does miss the durable Saudi advantages: $15 billion of PIF liquid cash, sovereign-rated debt capacity, the structural OPEC+ position, the demonstrated ability to issue $7 billion bonds at 3.4x oversubscription even at wartime spreads. The kingdom is not in freefall. It is in the slow phase of an adjustment whose acute phase the Q1 numbers have begun to leak.
The danger of the Tehran framing is not that it is too pessimistic. It is that it allows Riyadh’s communications apparatus to dismiss the underlying data by attacking the messenger. The 0.2% private non-oil QoQ print would be a problem if Mehr News had never been founded.
The Sequencing Problem Riyadh Cannot Speed Up
The Q1 release lands inside a sequencing problem the kingdom cannot accelerate from its own side. Hormuz reopening requires either a US-Iran deal — Round 5 of which produced what Omani Foreign Minister Badr al-Busaidi described on May 23 as “some but not conclusive progress” — or a unilateral Iranian decision to dismantle the PGSA toll regime, which Iranian foreign ministry spokesman Ismaeil Baghaei explicitly decoupled from the nuclear file on May 21. Neither route runs through Riyadh.
The fiscal adjustment that the 2014-16 precedent suggests is coming requires political preparation, contractor negotiation, and subsidy reform sequencing that the kingdom has not begun publicly. A Crown Prince who has just hosted a Trump state visit and announced $142 billion in arms commitments is not in a position to telegraph 14% spending cuts in the following quarter. The political economy of the adjustment is hostile to its own timing.
Meanwhile the deficit-financing apparatus is doing what it was built to do. PIF returns to the bond market. NDMC runs a steady cadence of sukuk issuance, 90% in private placements that do not test broad market depth. Aramco’s dividend continues; its profit performance underwrites it. The state can finance through 2026 at wartime spreads, and probably through 2027 at wider spreads still — the question is what the country looks like when the financing run ends and the structural adjustments deferred by the financing run all arrive at once.
The honest read of the Q1 2026 release is that the diversification metric most cited by ministers is the metric most contaminated by the fiscal transfer it is meant to have transcended. The 2.8% YoY non-oil growth is real; it is also state-funded. The 0.2% private QoQ print is small; it is also the first reading we have of what non-oil growth looks like in the wartime fiscal architecture.
Two to four quarters from the adjustment, the GASTAT release that lands will not need decomposition. By then the headline number will show it.
Frequently Asked Questions
What is the difference between government activities and non-oil GDP in the Saudi statistical framework?
GASTAT separates GDP into oil activities, non-oil activities, government activities, and net taxes on products in its quarterly contribution decomposition. Government activities — primarily public administration, defence services, and education — make up roughly 14% of total Saudi GDP and are reported as a separate contribution line. However, when ministers cite “non-oil GDP” in headline framing, the figure typically refers to the combined non-oil and government share, which together represent approximately 56% of the economy. In that broader framing, roughly 25% of “non-oil GDP” is direct government services, and an additional substantial share — including most of the construction sector at 8% of total GDP — is government and PIF project-driven rather than market-financed.
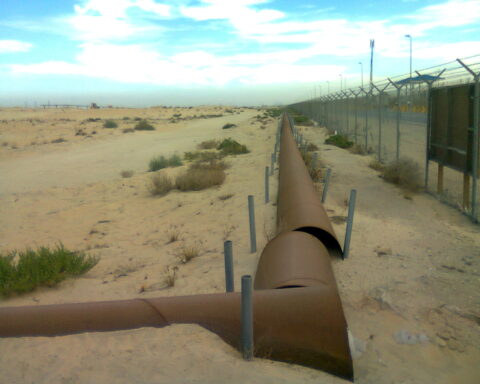
What is the East-West Pipeline ceiling and why does it matter?
The East-West Crude Oil Pipeline, known as Petroline, carries Saudi crude from Abqaiq in the Eastern Province to the Red Sea terminal complex at Yanbu, bypassing the Strait of Hormuz entirely. Its nameplate capacity is 5 million barrels a day. Yanbu’s tanker loading and storage infrastructure caps practical throughput at that ceiling regardless of how much crude is pumped at the eastern end. With Hormuz partially closed, the pipeline is the only route to international markets for the bulk of Saudi exports, and it cannot accommodate the full 10.291 million-barrel OPEC+ quota or anything close to it. The 2.53 million-barrel gap between quota and deliverable output is the direct measure of stranded Saudi capacity.
How does PIF bond issuance at wartime spreads compare to pre-conflict pricing?
The May 2026 PIF $7 billion three-tranche issuance priced at a 79 basis-point spread differential to Abu Dhabi sovereigns, a gap that did not exist before the Iran war. In Q4 2025, PIF paper traded at near-parity with comparable UAE sovereign-adjacent debt because both reflected stable Gulf risk profiles. The widening reflects investor pricing of Saudi-specific exposure to the Hormuz closure, the elevated military spending trajectory, and the fiscal deficit profile. Each subsequent issuance at these spreads compounds the financing burden, because higher coupons on new debt raise the average cost of carrying the sovereign-adjacent debt stack.
Why did Aramco profits rise while government oil receipts fell?
Aramco’s net income reflects total revenue minus costs and royalties, and benefited from the elevated Brent average across Q1 2026. The Saudi government’s share of Aramco’s output is captured through royalties, income tax, and dividends, all of which are structured around the volume the company sells. When volume falls sharply because of the Hormuz constraint, the government’s per-barrel take on each barrel that does ship rises with price — but the total number of barrels collapsing offsets the per-barrel gain. Aramco can also smooth its dividend through balance sheet management, which the sovereign cannot do with budget receipts that fund current operating spending.
What would a fiscal adjustment look like based on the 2016-17 template?
The 2016-17 Saudi fiscal adjustment combined a 14% nominal spending cut, partial energy subsidy reform that raised gasoline and electricity prices, the introduction of expat dependant fees, the deferral of contractor payments by up to nine months, and the 2018 introduction of a 5% value-added tax that was later raised to 15%. Any 2026-27 adjustment would likely revisit a similar menu, with subsidy reform politically the most difficult given that subsidies are up 170% YoY precisely because Riyadh has expanded them to cushion the inflation impact of the war. The deferral of contractor payments is the lever most directly applicable to the non-oil GDP measurement, because it converts immediately into reduced construction and services activity.