
{“content”: “
Saudi Arabia’s Economy Is Recovering. That Is the Problem.
n
RIYADH u2014 Saudi Arabia’s non-oil purchasing managers’ index rose to 51.5 in April from 48.8 in March u2014 the first expansion reading since the war began u2014 and the recovery will cost the state more than the contraction did. A domestic demand rebound without export revenue recovery means the Kingdom’s fiscal machinery must fund an expanding non-oil economy from a structurally diminished oil income base, with a structural export gap of 1.1 to 1.6 million barrels per day that cannot reach market even at maximum bypass utilization.
n
The consensus interpretation u2014 led by Riyad Bank’s chief economist Naif Al-Ghaith, who called the reading evidence of “a constructive and resilient trajectory for the Kingdom’s non-oil sector” u2014 treats the PMI print as vindication. The same survey recorded input cost inflation at the fastest rate in its 17-year history and export orders collapsing at the fastest pace since the index launched in August 2009. These are not data points that belong in the same paragraph as “resilient trajectory.” They belong in a fiscal stress test.
n
The Middle East briefing 3,000+ readers start their day with.
One email. Every weekday morning. Free.
Table of Contents
n
- n
- The Anatomy of a Misleading Recovery
- What Does a PMI Rebound Mean When Oil Revenue Has Collapsed?
- The Offset Thesis and Its Failures
- The Domestic Crude Burn Problem
- Why Is Vision 2030 Failing in the Direction Nobody Predicted?
- Q1 GDP: The Base Effect Mirage
- How Close Is Saudi Arabia to Its Debt Ceiling?
- The PIF Circularity Problem
- The Q2 Cliff
- FAQ
- n
n
n
n
n
n
n
n
n
n
n
n
n
n
n
The Anatomy of a Misleading Recovery
n
The Riyad Bank / S&P Global Saudi Arabia PMI covers approximately 400 non-oil private sector firms. In April, the headline composite rose 2.7 points to 51.5 u2014 crossing the 50-threshold that separates expansion from contraction. The new orders subindex jumped from 45.2 to 51.5. Firms reported progress on existing projects and a pickup in client demand.
n
Read the subcomponents and the picture inverts. New export orders fell at the fastest rate since S&P Global began the survey. Input costs u2014 freight, raw materials, imported components u2014 rose at the fastest pace in the survey’s entire history. Output charges rose at the fastest clip since 2009 as firms passed costs through. Delivery times lengthened. Firms built precautionary inventories, tying up working capital against supply chain disruption.
n
S&P Global’s own commentary notes that “delays in client spending and investment decisions” persisted and that “the overall rate of business expansion continued to be dampened by deferrals.” The recovery is sentiment-driven and backlog-driven. Firms are drawing down existing contracts, not booking new investment. This distinction matters because backlog drawdown is finite. It describes an economy metabolizing pre-war commitments, not generating post-war growth.
n
The survey is a diffusion index u2014 it measures breadth of improvement, not magnitude. A firm reporting “slightly more activity than last month” counts the same as one reporting a surge. After March’s 48.8 (the lowest reading since the war’s onset), some mean reversion was mechanical. The question is not whether 51.5 is real. It is whether 51.5, in this configuration, is good news for the state’s balance sheet.
n
What Does a PMI Rebound Mean When Oil Revenue Has Collapsed?
n
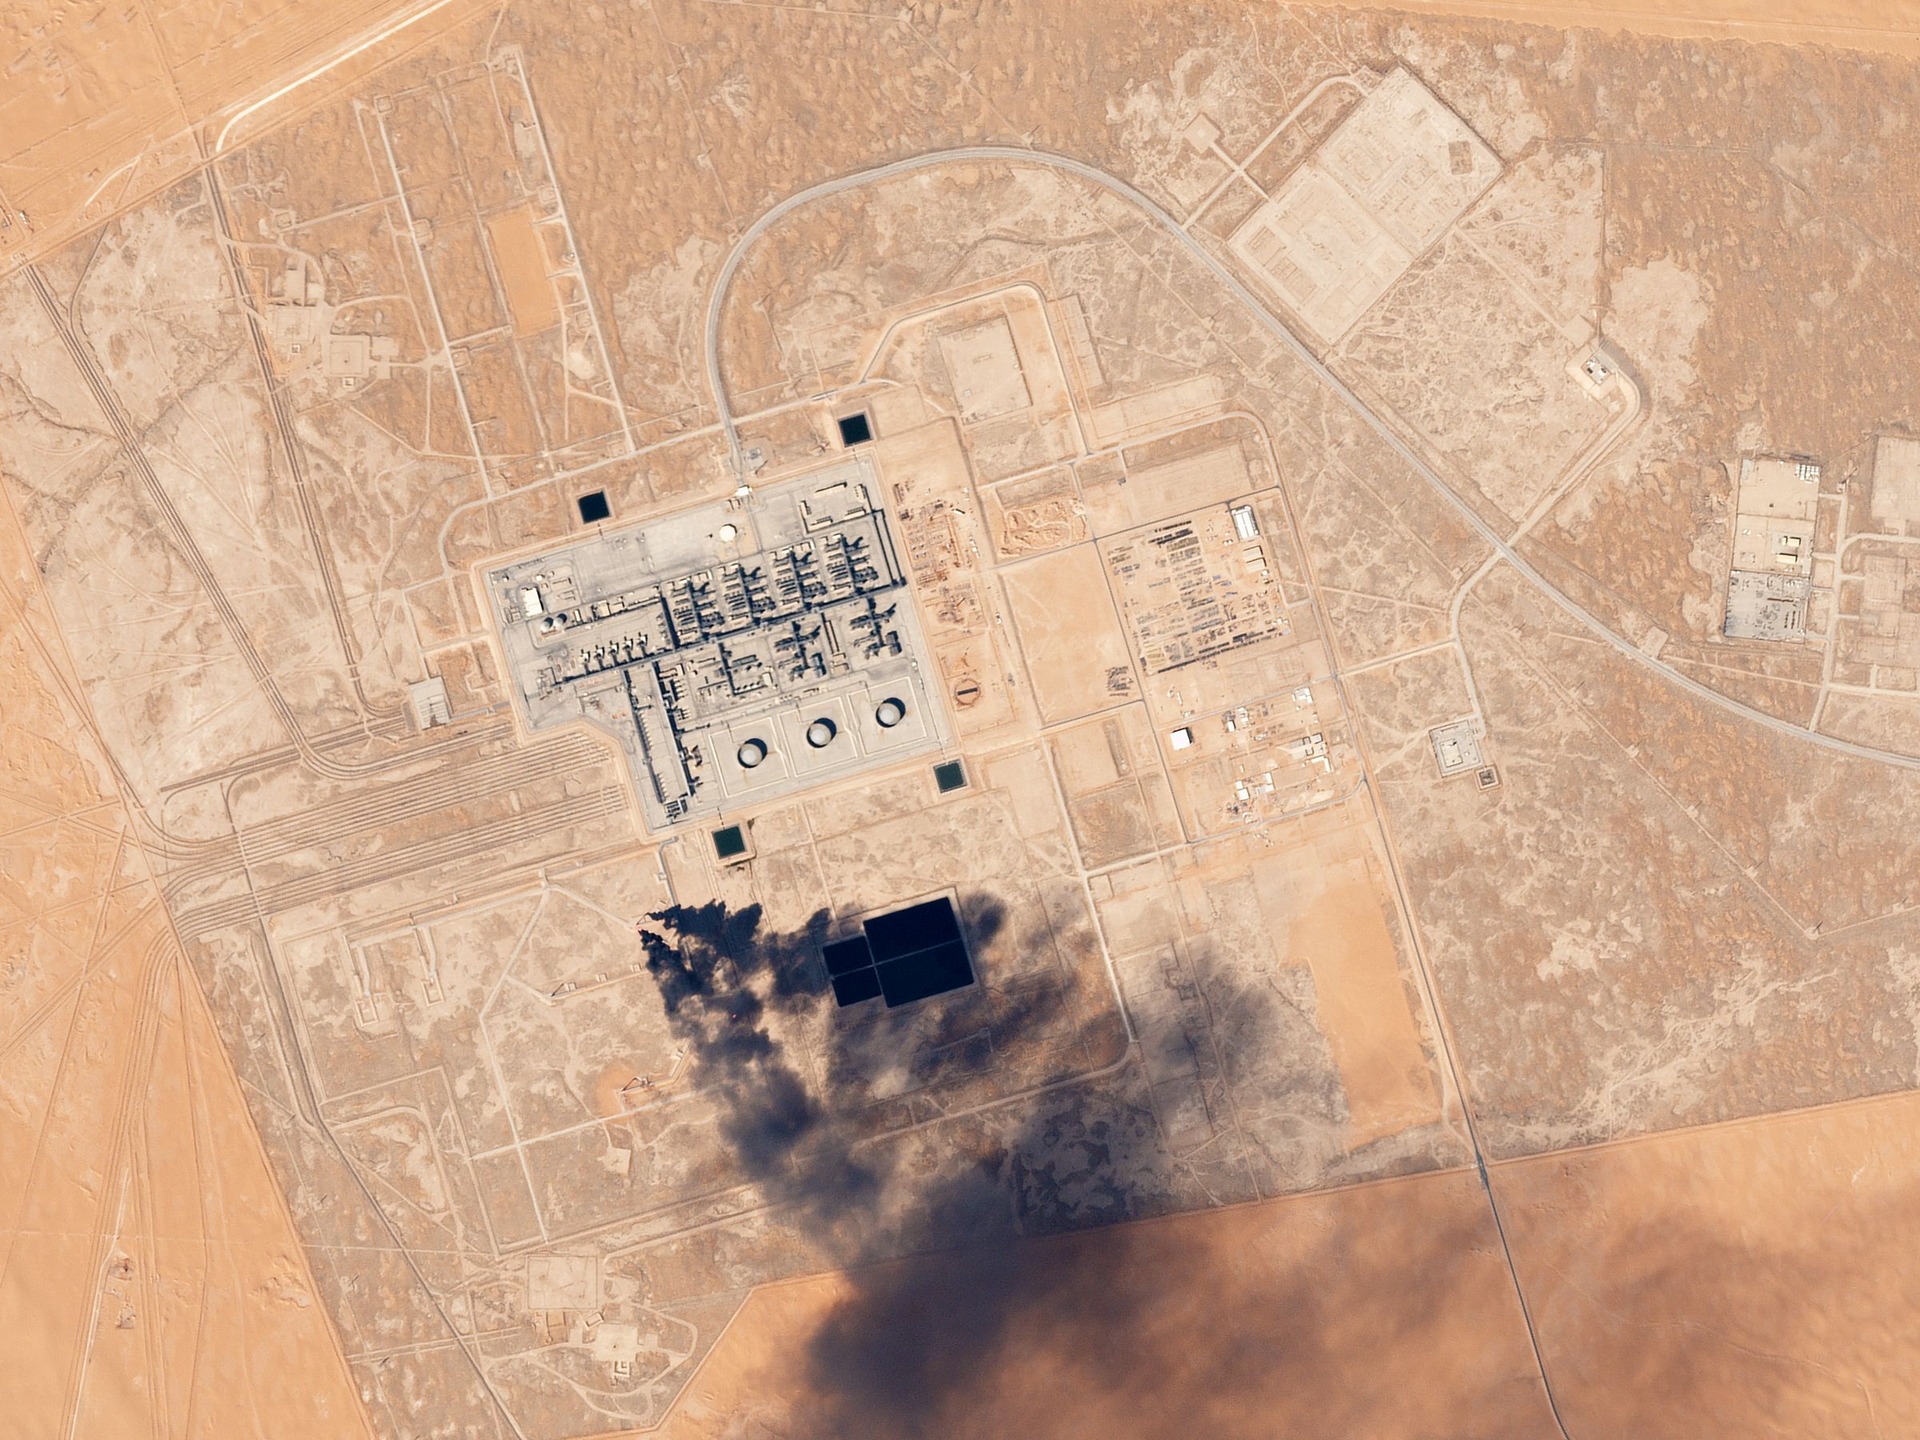
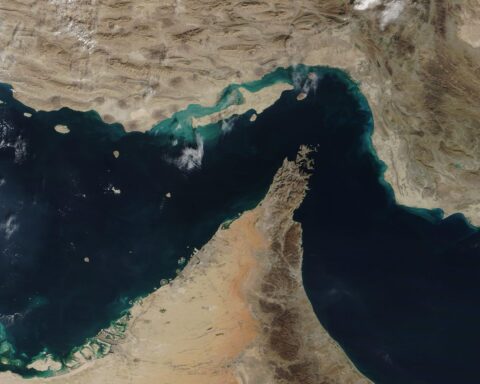
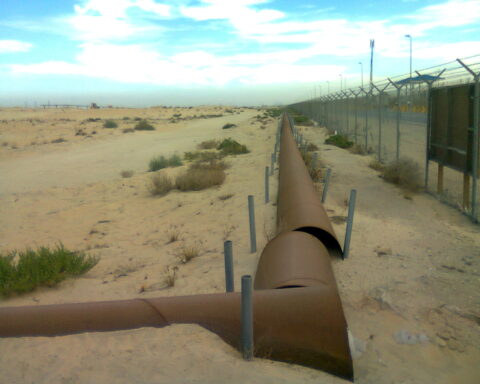
Saudi Arabia produced 7.25 million barrels per day in March, down from 10.4 million in February u2014 a 30% collapse that the International Energy Agency called “the largest single-country supply disruption” it has ever recorded. The East-West Pipeline’s Yanbu terminus provides a bypass around the Hormuz chokepoint, but its effective loading ceiling is 4u20135.9 million barrels per day. The structural export gap u2014 1.1 to 1.6 million barrels per day that cannot reach market even at maximum bypass utilization u2014 is not a temporary disruption. It persists for as long as Hormuz remains functionally closed.
n
Into this production collapse, inject a recovering domestic economy. When non-oil private sector activity expands, the state’s transfer obligations expand with it. Three channels:
n
First, energy subsidies. Saudi residential electricity is priced at SAR 0.200 per kilowatt-hour (USD 0.053) u2014 33.7% of the global average. The UNDP estimated Saudi explicit and implicit fossil fuel subsidies at $253 billion in 2022, equivalent to 27% of GDP. A recovering domestic economy consumes more subsidized energy. Every additional megawatt-hour of domestic consumption at subsidized rates is a barrel not exported at $113.
n
Second, Citizens’ Account Program (CAP) cash transfers. These are means-tested but cover approximately 13 million beneficiaries. As input cost inflation hits households u2014 the PMI confirms firms are passing through record cost increases u2014 political pressure to expand or supplement CAP payments intensifies. The 2016 austerity experience, when energy subsidy cuts were partially reversed by royal decree in January 2018 after social backlash, demonstrated the asymmetric ratchet: cuts are reversible; the political cost of cutting is not.
n
Third, PIF domestic capital expenditure. The Public Investment Fund’s 2026u20132030 strategy allocates 80% of deployment domestically. Between 2021 and 2025, PIF contributed $243 billion to non-oil GDP (cumulative economic output impact) and spent over $157 billion with local private sector firms. The “private sector” PMI is therefore partly measuring demand generated by state-backed capital spending. It is not independent of the fiscal position u2014 it is a reflection of it. When PIF spends domestically, the PMI rises. When the PMI rises, the consensus declares diversification is working. The circularity is structural.
n
| Fiscal Metric | Value | Source |
|---|---|---|
| Official 2026 deficit projection | 3.3% GDP / SAR 165bn | Saudi MoF |
| Goldman Sachs war-adjusted deficit | 6.6% GDP / ~$80u201390bn | Goldman Sachs / Bloomberg |
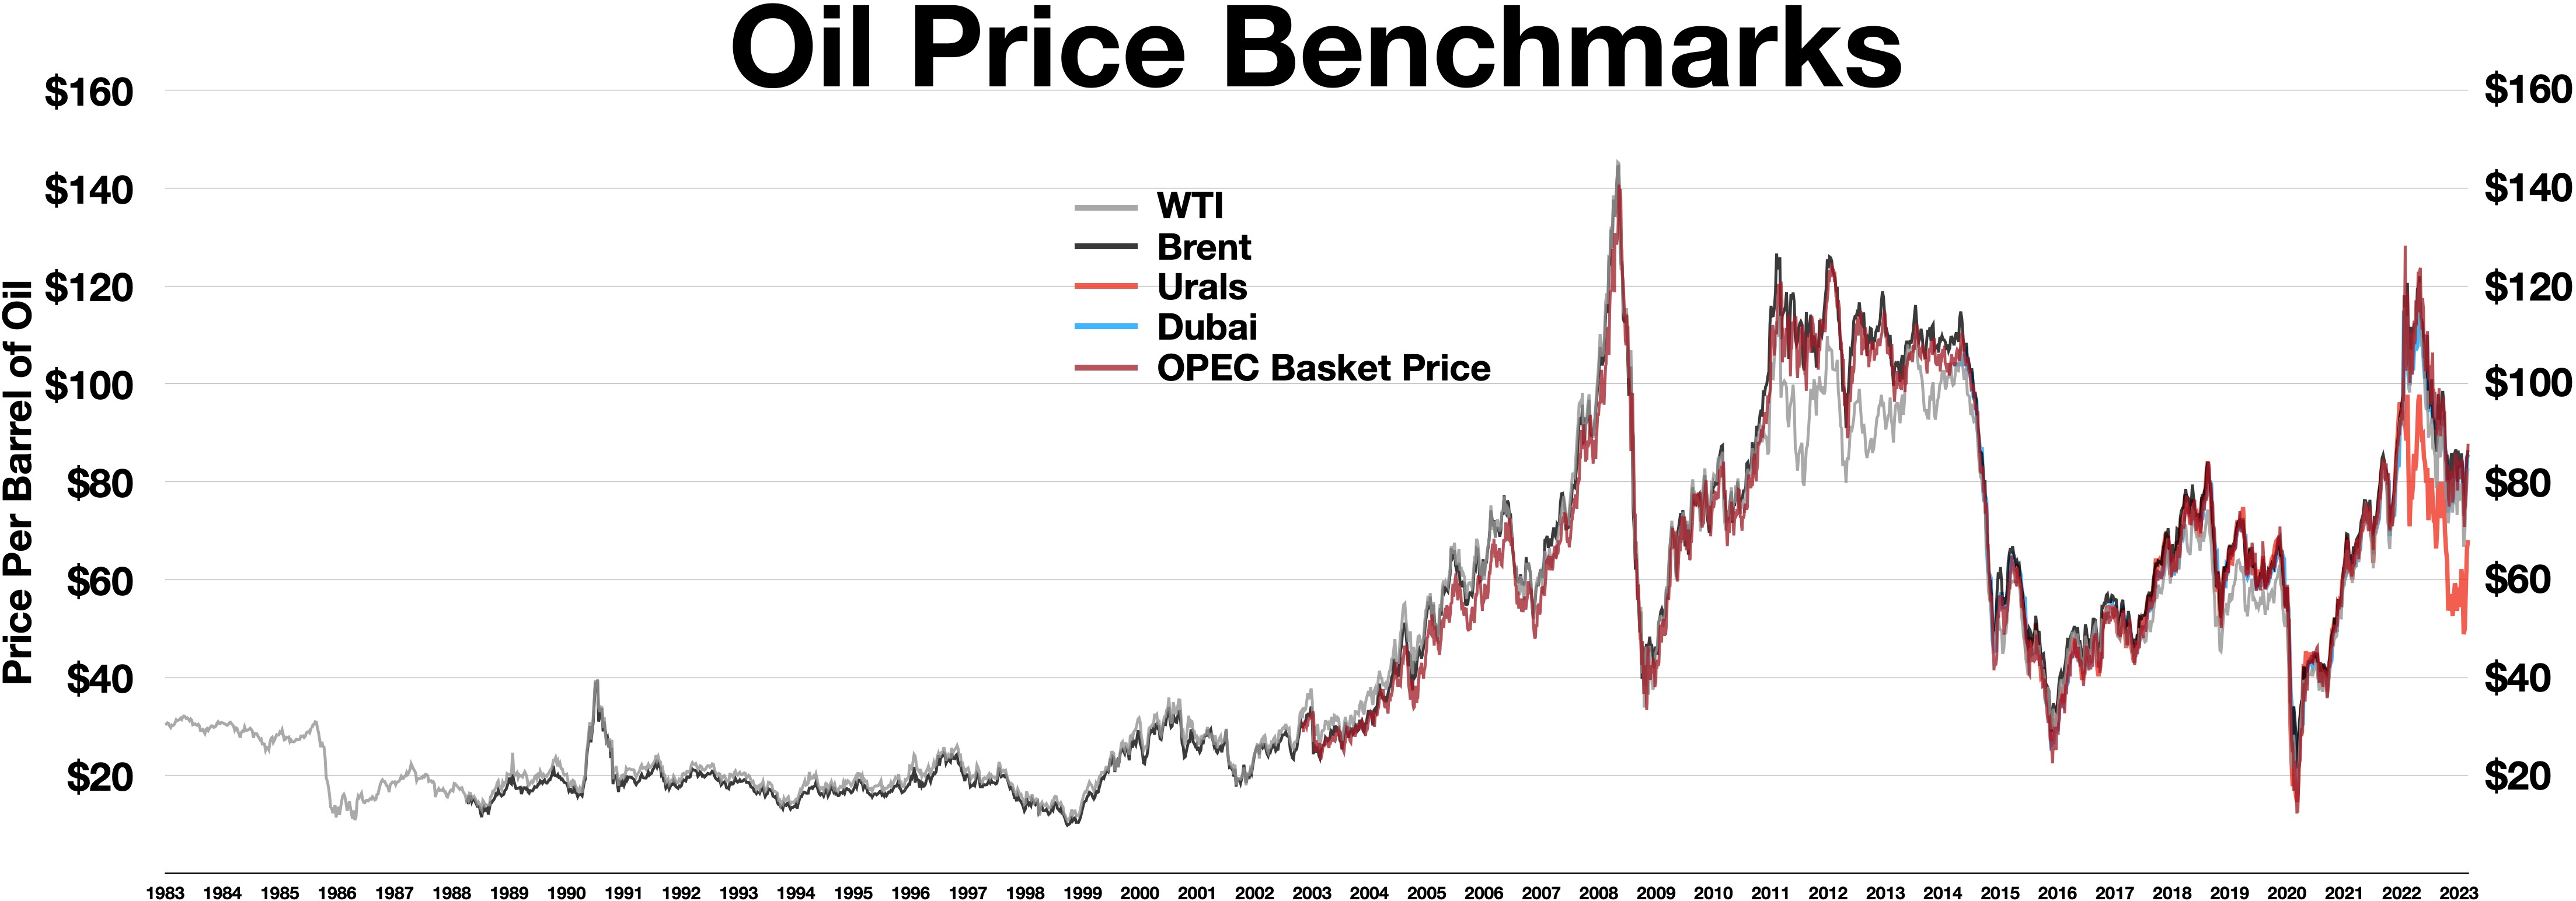
| PIF-inclusive fiscal break-even | $108u2013111/bbl Brent | AGSI |
| Brent crude (May 5, 2026) | ~$113u2013115/bbl | TradingEconomics |
| Break-even headroom | $2u20137/bbl | Calculated |
| Public debt projection (end-2026) | 36% GDP | Budget reports |
| Self-imposed debt ceiling | 40% GDP | Saudi government |
| Energy subsidies (2022) | $253bn / 27% GDP | UNDP |
n
n
The Offset Thesis and Its Failures
n
The prevailing market consensus u2014 articulated by AGBI on April 30 as “economists say that the impact of reduced oil production on the Saudi budget will be largely offset by higher prices” u2014 rests on a category error. It conflates Aramco’s corporate profitability with the Saudi government’s fiscal revenue.
n
AlJazira Capital forecasts Aramco’s Q1 2026 net profit at SAR 108.8 billion ($29 billion), up 56.7% quarter-on-quarter. At the corporate level, higher per-barrel revenue is partially offsetting lower volume. Aramco’s margins widen when Brent rises because its lifting costs remain among the world’s lowest.
n
But the state collects from Aramco through three channels: royalties (a per-barrel charge on production), dividends (a function of net profit), and income tax (a percentage of taxable income). Royalties scale with volume u2014 they decline linearly with production cuts regardless of price. The dividend is fixed at $124.3 billion annually through 2028, set before the war. It is not a windfall mechanism; it cannot capture per-barrel gains. Only the income tax channel benefits from higher per-barrel margins, and it operates with a lag.
n
The offset thesis assumes that what is profitable for Aramco is revenue-neutral for the state. This is arithmetically wrong. Saudi government revenue is a function of barrels produced multiplied by the government’s per-barrel take, not of Aramco’s profit margin. Production at 7.25 million barrels per day versus 10.4 million is a 30% reduction in the royalty base regardless of what Brent does.
n
Goldman Sachs and Bank of America both estimated, before the war began, that the 2026 fiscal deficit would reach approximately 6.6% of GDP u2014 double the government’s official 3.3% projection. That estimate assumed OPEC+ cuts, not a war-driven production collapse of 3.15 million barrels per day. The war-adjusted deficit has not been formally re-estimated by either institution, but the directional pressure is unambiguous.
n
n
The Domestic Crude Burn Problem
n
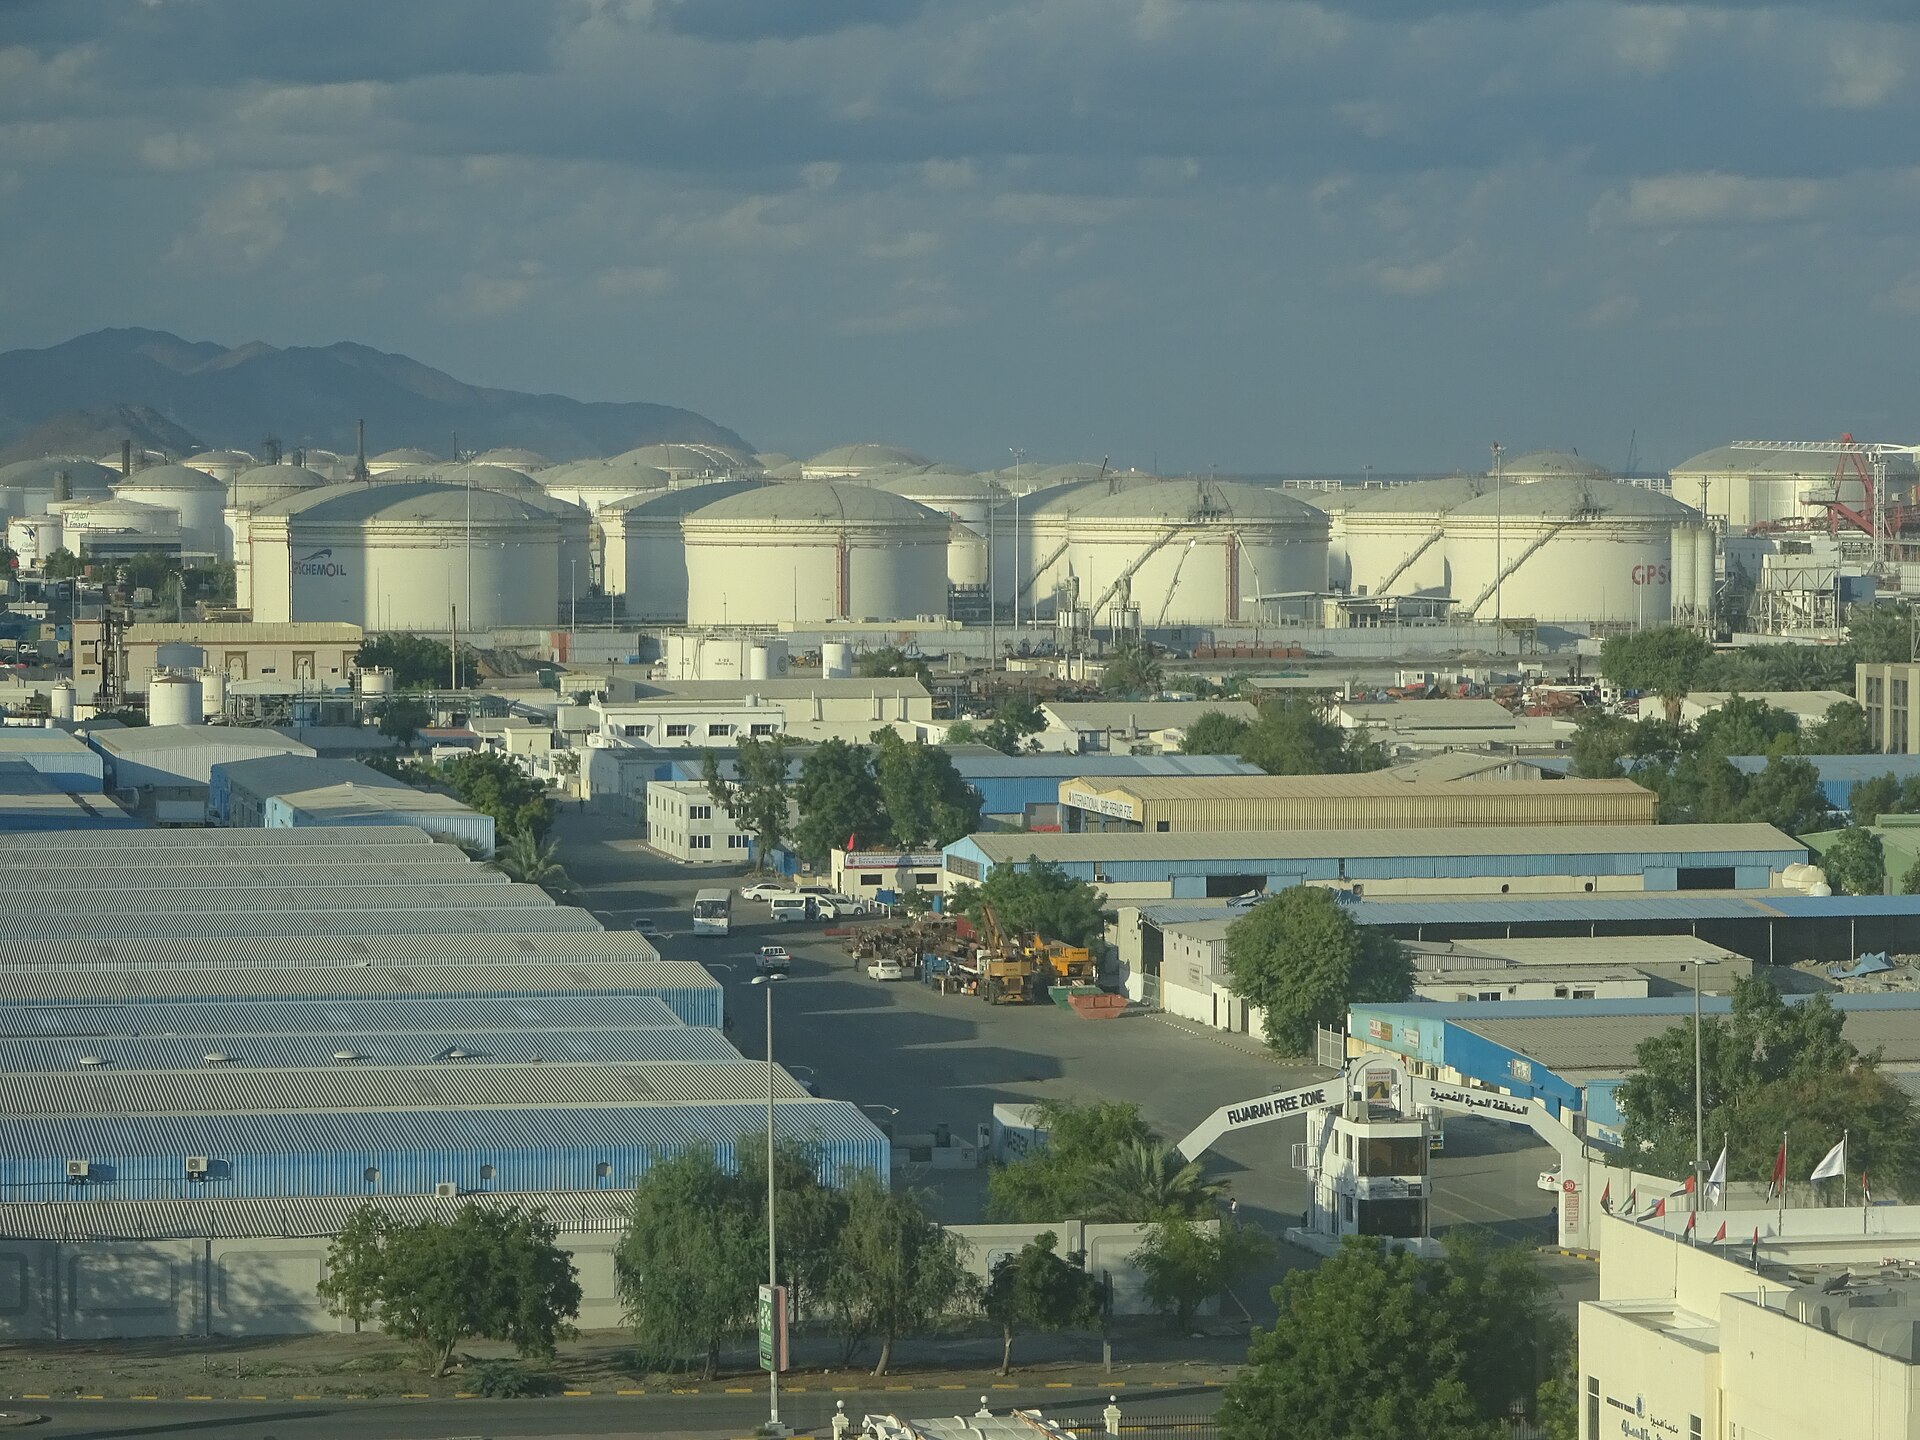
Saudi Arabia burns approximately 100 million barrels of crude oil per year for domestic power generation. At $113 per barrel Brent, this represents $11.3 billion in forgone export revenue annually u2014 crude consumed domestically that could otherwise transit Yanbu to international buyers.
n
The domestic burn problem compounds the PMI recovery problem. A rebounding non-oil economy consumes more electricity. Saudi energy consumption has risen 3.5% annually since 2021 (Enerdata). Each percentage point of non-oil GDP growth generates incremental power demand that must be met from crude oil combustion, because the gas infrastructure that would displace oil-fired generation u2014 principally the Jafurah unconventional gas field u2014 is at least two years from commissioning at scale.
n
At the margin, domestic PMI recovery competes directly with export capacity for the same barrels. When the pipeline bypass already imposes a structural ceiling, every barrel burned domestically is a barrel subtracted from an already-constrained export volume. This is the mechanism through which a non-oil recovery becomes a fiscal cost: it increases domestic energy demand at precisely the moment when each exported barrel carries maximum fiscal value.
n
Why Is Vision 2030 Failing in the Direction Nobody Predicted?
n
Vision 2030’s central bet was that non-oil economic diversification would reduce Saudi Arabia’s fiscal dependence on hydrocarbon revenue. By conventional metrics, the program has delivered: non-oil GDP rose from 45.4% of real GDP at launch in 2016 to 55.6% by the end of 2025 (GASTAT / Vision 2030 Annual Report). PIF deployed $199 billion in new project commitments over 2021u20132025. The private sector PMI spent most of 2023u20132025 above 55.
n
The war has exposed a structural flaw in the diversification thesis that no pre-war stress test anticipated. The assumption was always that oil revenue might fall (through price collapse or voluntary production cuts) and that non-oil growth would cushion the impact. The scenario being tested now is different: oil revenue has fallen while non-oil activity demands more state funding, not less.
n
Vision 2030’s non-oil sectors are not yet self-financing. Tourism, entertainment, NEOM, the Red Sea developments, Diriyah Gate u2014 these generate activity and employment, but their fiscal contribution (tax revenue, fees, profit repatriation to PIF) remains far below their fiscal cost (subsidized inputs, infrastructure capex, direct PIF equity). The non-oil economy in 2026 is a net consumer of state resources, not a net contributor. When that economy recovers from a wartime dip, it consumes more resources, not fewer.
n
Within that picture, PIF has now formally restructured its NEOM exposure. Al-Rumayyan’s April confirmation that The Line’s 2030 targets are abandoned and Oxagon is the sole deliverable is the clearest signal yet that PIF’s domestic deployment will consolidate around industrial output u2014 the one NEOM component with a plausible near-term revenue line u2014 rather than the residential megastructure that was always the program’s most capital-intensive component.
n
The failure mode is not that diversification didn’t work. It is that diversification worked as a GDP composition exercise while leaving the funding model unreconstructed. The state still funds diversification from oil revenue. When oil revenue contracts, diversification becomes a liability on the balance sheet rather than a hedge against the very contraction that triggered it.
n
n
“Signals a constructive and resilient trajectory for the Kingdom’s non-oil sector, reinforcing the broader narrative of economic diversification under Vision 2030.”
n
u2014 Naif Al-Ghaith, Chief Economist, Riyad Bank (PMI press release, May 5, 2026)n
n
n
Al-Ghaith’s framing is institutionally rational u2014 Riyad Bank sponsors the survey and benefits from optimistic interpretation. But the “resilient trajectory” he identifies is sustained by state capital flows that themselves depend on the oil revenue base now under structural compression. Resilience funded by a depleting source is not resilience. It is a drawdown rate.
n
Q1 GDP: The Base Effect Mirage
n
GASTAT reported Q1 2026 real GDP growth at 2.8% year-on-year on May 1. The figure conceals more than it reveals. On a seasonally-adjusted quarter-on-quarter basis, GDP contracted 1.5%. The oil sector shrank 7.2% QoQ. Non-oil activities grew 0.2% QoQ u2014 statistically indistinguishable from zero.
n
The year-on-year oil figure (+2.3%) is a base effect artifact. The war began in late February 2026; Q1 therefore includes January and most of February at pre-war production levels of 10.4 million barrels per day. The year-ago Q1 2025 was an OPEC+ voluntary-cut quarter with production around 9 million. So Q1 2026 oil GDP looks positive year-on-year despite March’s collapse to 7.25 million u2014 because the first two months of the quarter carried pre-war production levels, and the comparator was depressed.
n
Q2 will have no such flattery. April, May, and June will all reflect wartime production constraints against a Q2 2025 base when Saudi Arabia was producing 9u20139.2 million barrels per day. The year-on-year oil GDP figure in Q2 will swing deeply negative. Reuters and Investing.com both noted this dynamic on May 1; AGBI’s analysis warned “economists warning that the worst could be yet to come.” The warning is directionally correct but understated u2014 Q2 is not a risk scenario, it is an arithmetic certainty.
n
The IMF revised Saudi 2026 GDP growth to 3.1% from 4.5% in its latest forecast, a 1.4 percentage-point cut attributed directly to the Iran war’s supply disruptions. Even this revision assumes the conflict de-escalates by mid-year and Hormuz partially reopens. Under a sustained-closure scenario through Q3, the IMF’s downside band extends below 2%.
n
| GDP Component | Year-on-Year | Quarter-on-Quarter (SA) | Source |
|---|---|---|---|
| Total Real GDP | +2.8% | -1.5% | GASTAT, May 1, 2026 |
| Oil Sector | +2.3% | -7.2% | GASTAT |
| Non-Oil Sector | +2.8% | +0.2% | GASTAT |
| IMF 2026 Forecast | 3.1% (was 4.5%) | u2014 | IMF / Arab Weekly |
n
n
n
How Close Is Saudi Arabia to Its Debt Ceiling?
n
Saudi public debt-to-GDP is projected to reach 36% by the end of 2026, up from 26% at end-2024. The government’s self-imposed ceiling is 40%. At current trajectory, that ceiling is approximately 18u201324 months away u2014 less if the Goldman deficit estimate proves closer to reality than the official 3.3%.
n
The ceiling is self-imposed, which means it can be raised. But raising it carries signaling costs. Saudi Arabia’s credit ratings (Moody’s A1, S&P A+, Fitch A+) price in fiscal discipline and the assumption that the sovereign will not borrow beyond its stated comfort zone. A ceiling breach u2014 or even a formal revision u2014 would trigger spread widening on outstanding eurobonds and raise the cost of new issuance at precisely the moment when the deficit is expanding.
n
CFR analysis during the war period documented rising FDI risk premiums across the GCC. Higher sovereign borrowing costs compound with private sector financing costs to raise the price of every PIF-backed project currently under construction. NEOM, the Red Sea, Diriyah Gate, and the entertainment megaprojects all carry project finance structures benchmarked to Saudi sovereign credit. A downgrade or outlook revision reprices the entire Vision 2030 capital stack.
n
The 4-percentage-point gap between 36% and 40% looks comfortable only if the deficit remains at official projections. At Goldman’s 6.6% war-adjusted estimate, the gap closes in a single fiscal year. The Kingdom issued approximately $17 billion in international bonds in 2024 and is on pace to exceed that in 2026. Each issuance brings the ceiling closer and the market’s tolerance lower.
n
The PIF Circularity Problem
n
PIF’s 2026u20132030 strategy commits 80% of new deployment to domestic projects, making it by far the largest single source of domestic non-oil demand. When the PMI survey asks 400 non-oil firms whether activity is expanding, a material share of the “yes” responses trace back, directly or through supply chains, to PIF-originated capital flows.
n
This creates a measurement problem and a fiscal problem simultaneously. The measurement problem: the PMI cannot distinguish between organic private sector demand and state-capital-stimulated demand. When Al-Ghaith cites the PMI as evidence that “diversification is working,” the evidence is contaminated by the fiscal expenditure it is supposed to be replacing. PIF spending drives PMI readings, which are then cited to justify further PIF spending.
n
The fiscal problem: PIF’s capital comes from three sources u2014 Aramco dividend transfers, government capital injections, and retained investment returns. The fixed Aramco dividend ($124.3 billion annually) is funded regardless of the fiscal position. Government capital injections compete with other spending priorities when deficits widen. Retained investment returns depend on global portfolio performance and domestic asset valuations, both under pressure from war risk premiums.
n
If the government’s war-adjusted deficit reaches Goldman’s 6.6% estimate, the political pressure to redirect PIF capital toward fiscal stabilization (covering the deficit, maintaining reserves, funding emergency transfers) rather than long-term domestic investment will intensify. PIF’s domestic capex is not a fixed obligation u2014 it is a policy choice that competes with immediate fiscal needs. A PMI recovery driven by PIF spending can be unwound by PIF spending reallocation.
n
The 2014u20132016 precedent is instructive. During that oil price crash, PIF domestic investment slowed, giga-project timelines extended, and the construction sector PMI (then measured separately) fell below 45 for seven consecutive months. The policy sequence was: oil revenue falls u2192 deficit widens u2192 state capex slows u2192 non-oil economy contracts u2192 PMI falls. The current configuration inverts the early stages (PMI recovering while oil revenue falls) but the endgame convergence is the same. State-funded demand cannot indefinitely outrun state revenue.
n
The Q2 Cliff
n
Aramco reports Q1 2026 earnings on May 10. AlJazira Capital’s forecast u2014 SAR 108.8 billion net profit, up 56.7% QoQ u2014 will be cited as evidence that higher prices are compensating for lower production. At the corporate level, this may be true for one quarter. At the government revenue level, the translation is incomplete: royalties fall with volume regardless of price, and the dividend is fixed.
n
But Q1 is not the quarter that matters. Q1 contained two months of pre-war production and one month of war-constrained production. Q2 will contain three full months of constrained production at 7u20137.5 million barrels per day. The base effect that flattered Q1 year-on-year figures (2.3% oil GDP growth) reverses violently in Q2, when the comparator is Q2 2025’s 9+ million barrels per day.
n
The PMI’s April recovery does not alter this arithmetic. Domestic non-oil activity can expand every month from now through June without changing the fact that the government’s revenue base has structurally contracted. If anything, the PMI recovery accelerates the fiscal pressure by increasing state transfer obligations (subsidies, CAP payments, PIF domestic deployment) against a revenue base that Q2 earnings will reveal in full.
n
Aramco’s May OSP for June-loading crude was reset to +$3.50/bbl above the benchmark u2014 a $16 reduction from the +$19.50 war-premium set for May loading when panic was at its peak. The OSP reduction reflects Yanbu’s loading constraints (customers cannot take delivery regardless of price) and the beginning of demand destruction at sustained triple-digit Brent. Asian crude loadings from Saudi Arabia fell 38.6% in the Marchu2013April period (Kpler). The price is high. The volume is not moving.
n
| PMI Subcomponent (April 2026) | Reading / Direction | Context |
|---|---|---|
| Headline PMI | 51.5 (from 48.8) | First expansion since war onset |
| New orders | 51.5 (from 45.2) | Domestic demand recovery |
| New export orders | Fastest decline since Aug 2009 | International demand collapse |
| Input costs | All-time survey high | Freight + raw materials |
| Output charges | Fastest rise since Aug 2009 | Firms passing through costs |
| Delivery times | Lengthening | Supply chain disruption |
| Inventories | Building (precautionary) | Working capital tied up |
n
n
The Aramco Q1 number will be good. The headlines will declare the offset thesis vindicated. By Q2, the arithmetic will be unavoidable: a high-price, low-volume equilibrium with rising domestic claims on the remaining barrels is a fiscal compression trap, not a windfall. The PMI’s recovery is the pressure valve opening u2014 and in this configuration, an open valve means faster depletion of the reservoir it draws from.
n
n
Frequently Asked Questions
n
What is the Saudi Arabia PMI and who publishes it?
n
The Saudi Arabia Purchasing Managers’ Index is a monthly diffusion index compiled by S&P Global and sponsored by Riyad Bank. It surveys approximately 400 non-oil private sector firms on output, new orders, employment, delivery times, and inventories. Readings above 50 indicate expansion; below 50 indicate contraction. The survey has been published monthly since August 2009 and is the most-watched leading indicator of Saudi non-oil economic activity. It does not measure government sector activity or oil sector performance, meaning it captures only a subset of total economic output.
n
Can higher oil prices fully offset lower Saudi production volumes for government revenue?
n
No. The offset operates imperfectly across the three government revenue channels from Aramco. Royalties are assessed per barrel produced and decline linearly with volume regardless of price. The base dividend ($124.3 billion annually) is fixed and does not flex with either price or volume. Only the income tax on Aramco’s profit and any performance-linked dividend respond to per-barrel margins. IMF estimates suggest that to fully offset a 30% production decline through price alone, Brent would need to sustain $145u2013155/bbl u2014 approximately $30u201340 above current levels. The “offset” is partial at best, covering perhaps 40u201350% of the revenue loss at $113 Brent.
n
How does the Hajj season interact with Saudi fiscal and energy pressures?
n
The 2026 Hajj season (Day of Arafah: May 26) adds approximately 1.2u20131.5 million pilgrims to domestic energy demand during peak summer months when Saudi electricity consumption already surges from air conditioning load. Hajj revenue (visa fees, services, transport) generates an estimated $12u201315 billion annually in direct and indirect economic contribution, making it a material non-oil revenue source. However, the security infrastructure required for wartime Hajj u2014 PAC-3 deployments down to approximately 400 interceptor rounds (14% of pre-war stocks), five-layer air defense over Makkah and Madinah u2014 represents an additional fiscal drain not captured in normal budget projections. The Kingdom cannot defer or cancel Hajj without surrendering the Custodian of the Two Holy Mosques legitimacy claim that anchors the Al Saud’s religious authority.
n
What happened when Saudi Arabia last faced a major fiscal squeeze?
n
During the 2014u20132016 oil price collapse, Saudi Arabia ran fiscal deficits of 15u201317% of GDP, drew down approximately $115 billion in central bank reserves, and implemented an austerity package in late 2016 that included energy subsidy cuts, public sector wage freezes, and the cancellation of allowances. The cost-of-living allowance (COLA) was reinstated by royal decree in January 2018 after sustained social pressure, demonstrating that fiscal consolidation carries asymmetric political risk in the Saudi system. The current situation differs in one critical respect: the 2014u20132016 squeeze was a demand-driven price collapse where production could be maintained; the 2026 squeeze is a supply-driven production collapse where the Kingdom physically cannot export its way to revenue recovery regardless of price. Saudi Arabia’s Q1 2026 fiscal data — released May 5, with SR125.7 billion ($33.5B) consumed in a single quarter against a SR165B full-year target — confirms that the gap between official forecasts and fiscal reality is now mathematically visible: the $44 billion full-year forecast ate itself in one quarter.
n
When will Saudi Arabia’s Jafurah gas field reduce the domestic crude burn problem?
n
Aramco’s Jafurah unconventional gas development in the Eastern Province targets 2 billion standard cubic feet per day of sales gas by 2027u20132028, with full ramp to 3.5 bcf/d by 2030. Even at initial commissioning, Jafurah would displace only a fraction of the ~100 million barrels per year currently burned for power generation. Full displacement requires both gas production and gas-fired power plant construction, with the latter carrying its own 2u20133 year development timeline. The realistic horizon for meaningful domestic crude burn reduction is 2029u20132030, meaning the fiscal cost of domestic consumption ($11.3 billion annually in forgone exports at current Brent) persists through the entire war-risk period under any plausible timeline.
n”}