
DHAHRAN — Brent crude closed at $99.36 on April 18 after IRGC gunboats fired on two Indian-flagged vessels in the Strait of Hormuz, and the 4.3 percent intraday surge created an arithmetic that Riyadh cannot discuss publicly: every dollar the IRGC adds to the barrel price partially offsets the war-adjusted fiscal deficit that Goldman Sachs estimates at 6.6 percent of GDP. At 7.25 million barrels per day — Saudi Arabia’s war-constrained output, down 30 percent from February’s 10.4 million bpd — each dollar on Brent generates approximately $2.65 billion in annualized revenue, meaning the $9 surge triggered by the tanker attack translates to roughly $23.8 billion in annualized earnings recovery.
The paradox is structural, not rhetorical. The same IRGC escalation that damaged Ras Tanura and the East-West Pipeline also narrowed Aramco’s May OSP inversion from $17 above effective spot economics to roughly $8. Riyadh is being partially bailed out by the adversary whose missiles forced the production cuts in the first place — and it cannot say so without validating the strategy that is destroying its own infrastructure.
Table of Contents
- The Tanker Attack Arithmetic
- Why Does Saudi Arabia Need IRGC Escalation to Narrow Its Deficit?
- How Did the May OSP Become Aramco’s Worst Contractual Bet?
- The Yanbu Ceiling and the Price That Cannot Save Riyadh
- Who Actually Captures the Windfall at $99 Brent?
- The 1990 Gulf War in Reverse
- What Does the $45 Gap Between Physical and Futures Brent Mean?
- The SAMA Reserve Runway
- Frequently Asked Questions
The Tanker Attack Arithmetic
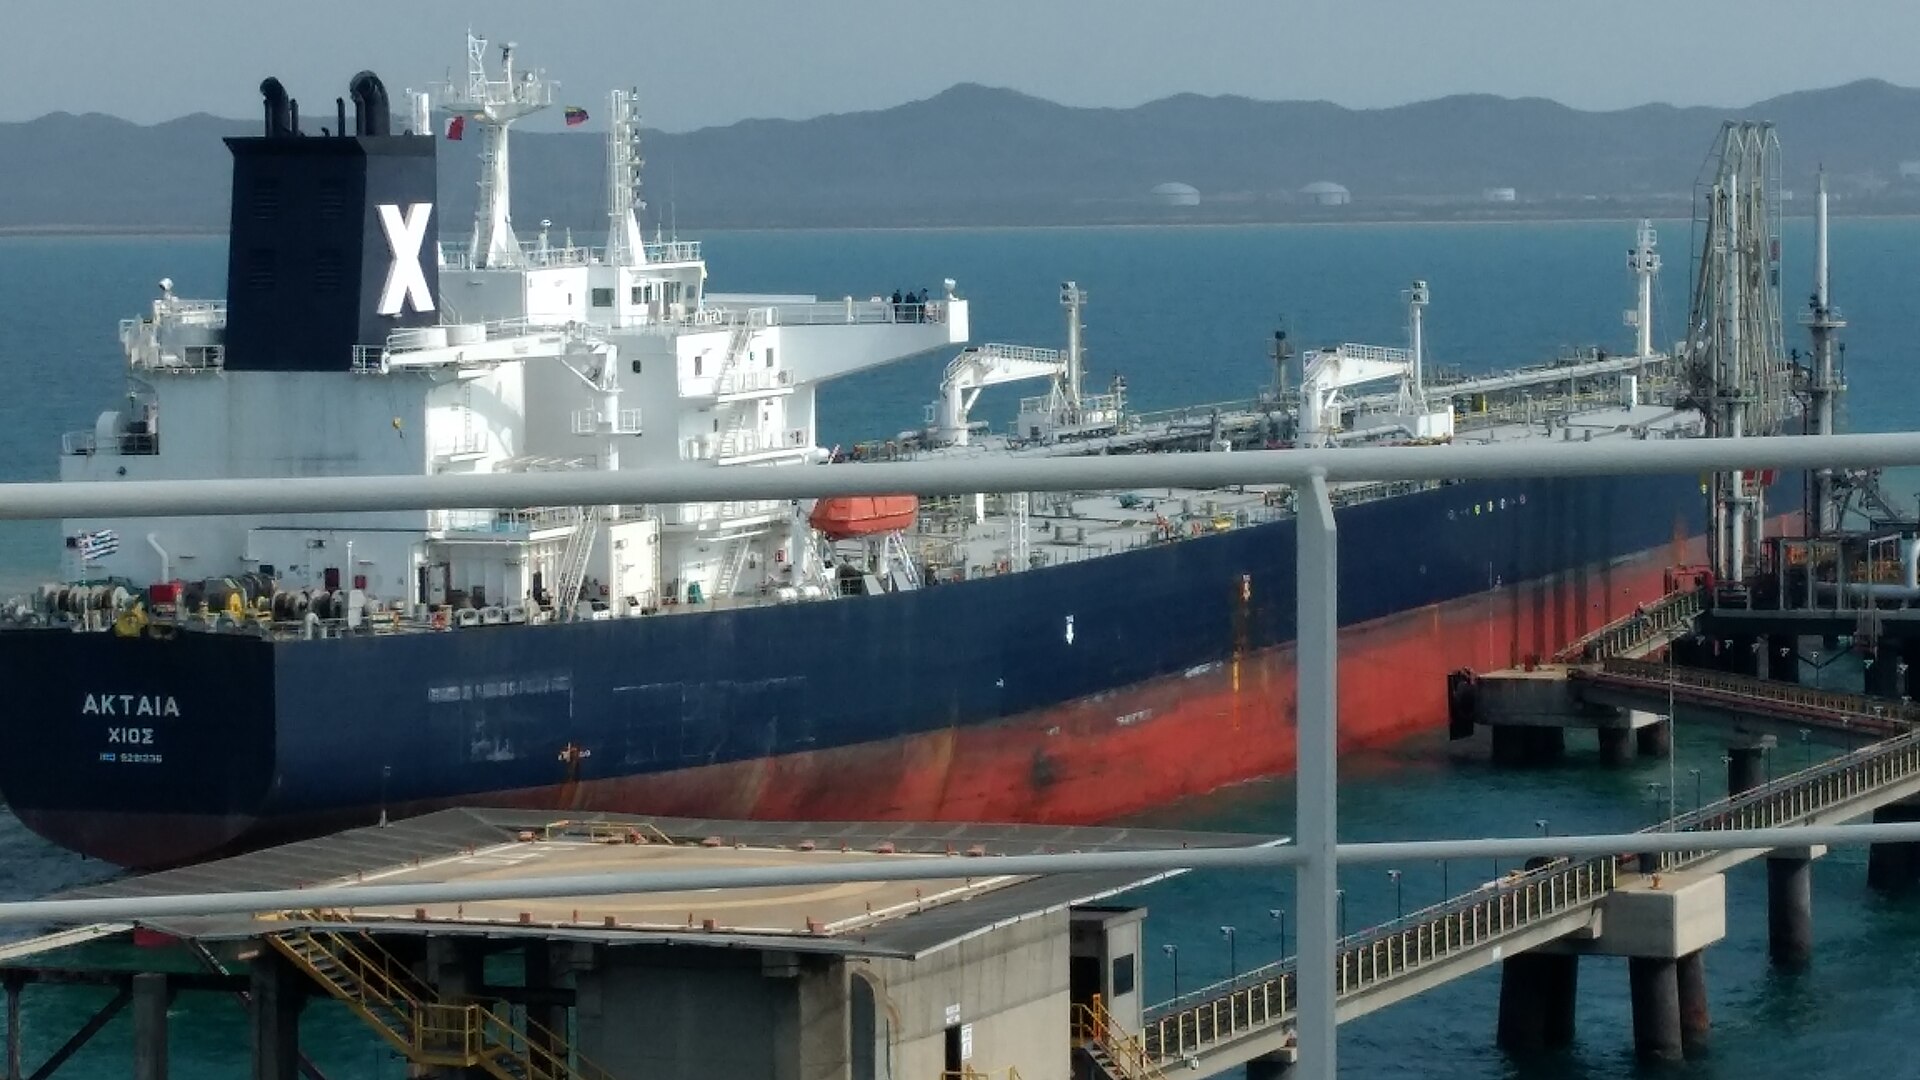
The Sanmar Herald, an Indian-flagged VLCC carrying approximately two million barrels of Iraqi crude, came under fire from IRGC gunboats between 10:40 AM and 12:00 PM ET on April 18 despite having received prior passage clearance. Audio captured a crew member shouting at the Iranian vessels: “You gave me permission to go… You are firing now!” The Jag Arnav, operated by Mumbai-based Great Eastern Shipping, was the second vessel forced to reverse course. Both ships survived. Brent did not come back down.
The price response was immediate and disproportionate to the physical damage. No cargo was lost. No oil spilled. But the attack confirmed what JPMorgan’s commodities desk had warned days earlier: “The last tanker to clear Hormuz on February 28 is expected to reach its destination around April 20, marking the point at which pre-closure barrels are fully exhausted from the global supply chain.” At $99.36, Brent priced in not the two ships turned back but the 150-plus tankers still anchored across Asia and the zero that have cleared Hormuz laden since late February.
India summoned Iranian Ambassador Dr. Mohammad Fathali the same evening. New Delhi has two destroyers, one frigate, and one tanker stationed in the Gulf of Oman. The summons was diplomatic; the naval deployment was not.
WTI closed at $99.08, up 2.6 percent — the first time both benchmarks have traded above $99 simultaneously since the brief spike following the 2019 Abqaiq-Khurais drone attack, when Brent surged 19.5 percent intraday to $71.95. The 2019 spike lasted hours. The 2026 price structure is cumulative, built on fifty days of near-total Hormuz closure, and the IEA has classified it as “the largest supply disruption in the history of the global oil market.” IRGC-affiliated media has made no effort to contextualise the price impact on Gulf exporters. The framing from Tehran — an Iranian military spokesperson told CNBC in March, “Get ready for oil to be $200 a barrel” — treats elevated prices as a weapon aimed at Western consumers, not as a subsidy inadvertently flowing to the adversary whose infrastructure Iran is striking.
The Middle East briefing 3,000+ readers start their day with.
One email. Every weekday morning. Free.

Why Does Saudi Arabia Need IRGC Escalation to Narrow Its Deficit?
Because at 7.25 million bpd, the volume Saudi Arabia can export is not enough to make fiscal break-even achievable at any politically realistic price. The PIF-inclusive break-even sits at $108–111 per barrel, according to Bloomberg Economics — and every dollar Brent rises at war-constrained production generates only $2.65 billion in annualized revenue, not the $3.80 billion it would produce at pre-war volumes.
The break-even figure captures $71 billion in PIF committed disbursements alongside central government spending. The IMF’s central-government-only break-even is lower, at $86.60, but that number excludes the sovereign wealth fund’s capital commitments that underwrite NEOM, The Line, and the broader Vision 2030 programme. At $99 Brent, Saudi Arabia remains $9–12 below the price that balances its actual expenditure.
The gap becomes acute when multiplied by constrained volumes. At pre-war production of 10.4 million bpd and $109 Brent, annualized Saudi oil revenue ran at approximately $379 billion. At 7.25 million bpd and $99 Brent, it runs at approximately $262 billion — a $117 billion annual shortfall driven by the intersection of lower prices and lower volumes. Goldman Sachs MENA economist Farouk Soussa has estimated the war-adjusted 2026 deficit at 6.6 percent of GDP, roughly $73 billion, double the official 3.3 percent forecast published before Iranian missiles hit Ras Tanura.
At pre-war volumes, each dollar on Brent would generate $3.80 billion in annualized revenue — a $1.15 billion gap per dollar that quantifies the infrastructure damage Iran has inflicted on Saudi earning capacity. The IRGC’s tanker attack on April 18 pushed Brent up $9, adding roughly $23.8 billion in annualized revenue. To reach fiscal break-even at current volumes, Riyadh would need Brent at approximately $144 — a price that would trigger the demand destruction Robin Mills of Qamar Energy has described as “Covid-era levels.”
“Everyone has to cut their oil use by about 10 percent. That is Covid-era levels of demand destruction. History shows $120 per barrel is not high enough. It looks likely to be at least $150, probably more.”
Robin Mills, Qamar Energy, AGBI, April 2026
How Did the May OSP Become Aramco’s Worst Contractual Bet?
Aramco set its May 2026 Official Selling Price at +$19.50 per barrel over the Oman/Dubai benchmark when Brent was at $109. When Brent crashed toward $90 in late March, term buyers faced a $17 premium above effective spot economics — forcing deferrals and run cuts across Asia. The IRGC’s April 18 tanker attack partially corrected the inversion by pushing prices back toward $99.
Bloomberg’s consensus survey had expected a premium of +$40 per barrel. Aramco came in $20.50 below consensus — a deliberate act of market-share preservation restraint, pricing for volume retention rather than margin maximisation at a moment when every Asian term buyer was calculating whether to lift May cargoes or defer.
The restraint became a trap. Brent’s crash — driven by the same production losses that constrained Saudi output — meant term buyers in South Korea and Japan faced a choice between lifting contracted barrels at a premium to what the spot market offered or paying the reputational cost of deferral. Asian refineries cut runs by roughly six million barrels per day in April, to 77.2 million bpd from pre-war levels, according to the IEA.
The April 18 tanker attack compressed the inversion. At $99 Brent, the May OSP premium narrows to approximately $8 above spot — still elevated, but within the range that term buyers will absorb rather than defer. The IRGC, by firing on the Sanmar Herald, partially healed Aramco’s contractual exposure. Aramco did not ask for this. Aramco cannot acknowledge it. The arithmetic does not require acknowledgment.
| Brent Price | May OSP Premium | Effective Spot Gap | Asian Buyer Response |
|---|---|---|---|
| $109 | +$19.50 | ~$0 | Full liftings at set price |
| $90 | +$19.50 | ~$17 above spot | Deferrals, run cuts |
| $99 | +$19.50 | ~$8 above spot | Grudging acceptance |
| $108–111 | +$19.50 | ~$0 | At-par: full liftings expected |
The June OSP has already been reset at +$3.50 per barrel — a $16 reduction from May that prices in the structural demand destruction Aramco’s commercial team could see in the lifting nominations. The reset is an admission: the May premium was set for a market that no longer exists.
The Yanbu Ceiling and the Price That Cannot Save Riyadh
Aramco CEO Amin Nasser confirmed on April 12 that the East-West Pipeline had been restored to its full seven-million-bpd design capacity. The pipeline runs 1,200 kilometres from the Eastern Province to Yanbu on the Red Sea, bypassing Hormuz entirely. It is the infrastructure that was supposed to make the strait’s closure survivable for Saudi exports.
The pipeline works. Yanbu does not — not at the throughput the pipeline can deliver. Yanbu’s berth and loading infrastructure caps actual liftings at 4–5.9 million bpd, against the pipeline’s seven-million-bpd capacity and pre-war Hormuz throughput of 7–7.5 million bpd for Saudi crude. The structural gap is 1.1–2.1 million bpd, and it cannot be closed by higher prices, faster pumping, or diplomatic progress in Islamabad. It requires physical berths, single-point mooring buoys, and tank farm expansion that takes 18–36 months to build.
This is the constraint that makes the fiscal paradox permanent for the duration of the conflict. Even if Brent reached $150 — the level Mills estimates would be required to balance supply and demand through forced destruction — Saudi Arabia at 7.25 million bpd would generate approximately $396 billion in annualized revenue. That is barely above the $379 billion it earned at $109 Brent with pre-war volumes. The 30 percent production decline has reduced Saudi Arabia’s sensitivity to price in the precise range where price sensitivity matters most.
Karen Young of Columbia University’s Center on Global Energy Policy has framed the constraint in programmatic terms: “The kingdom may have to delay or scale back some of its Vision 2030 projects.” The statement is careful. The implication — that the physical ceiling at Yanbu converts a price windfall into a volume discount — is the part she left to the reader.
Who Actually Captures the Windfall at $99 Brent?
The answer is not Saudi Arabia, not fully. And it is not Iran, not at all. Riyadh has privately demanded the US lift that blockade, warning that its continuation raises the probability of a Houthi closure of Bab el-Mandeb — the sole exit for Yanbu’s exports. That demand, detailed in Saudi Arabia’s private push to end the Hormuz blockade, represents the clearest signal yet that Riyadh views the US naval posture as a direct threat to its own remaining export corridor. The US naval blockade effective April 13 has sealed Iranian export capacity — the same blockade that coincided with the non-renewal of OFAC General License U on April 19. Iran warned in March that “oil could reach $200 a barrel, because the oil price depends on regional security, which you have destabilised,” according to an Iranian military spokesperson quoted by CNBC. Brent is halfway there. Iran collects nothing from it.
The windfall flows unevenly. VLCC day rates hit $423,000 on the Middle East-to-China route in late March — unprecedented in data going back to 2005, according to Tankers International. War risk insurance premiums for Hormuz transits peaked above 5 percent of hull value per passage, per Lloyd’s List. Shipowners and insurers are capturing margin that in a functioning market would flow to producers and consumers.
Saudi crude sales to China are set to halve for May — from approximately 40 million barrels in April to roughly 20 million barrels, according to Bloomberg — as Sinopec and CNPC face bilateral allocation restrictions. The volume loss partially offsets the price gain. At $99 Brent, 20 million barrels of May China sales generate roughly $1.98 billion. At $90 Brent with 40 million barrels, the same month generated $3.6 billion. Higher price, fewer barrels, less revenue from Riyadh’s largest customer. The Chinese demand constraint is separate from the Yanbu bottleneck — it reflects Beijing’s own internal allocation politics rather than Saudi infrastructure limits — but the fiscal effect is additive.
CSIS senior associate Raad Alkadiri has captured the structural bind: “OPEC+’s market management task this year just got a lot more difficult at a time when fiscal pressure on key producers, including Saudi Arabia, is growing sharply.” The April OPEC+ quota for Saudi Arabia stands at 10.2 million bpd — three million above actual output, a gap that measures the distance between the cartel’s paper architecture and the physical reality of damaged loading terminals.
The 1990 Gulf War in Reverse
The closest historical analogue to Saudi Arabia’s current fiscal position is the 1990 Gulf War — but inverted in every dimension that matters. Iraq’s invasion of Kuwait triggered a price spike from approximately $15 to $41 per barrel. Iraq captured zero revenue from the surge it caused; UN sanctions blocked all exports. Saudi Arabia captured the windfall by ramping production from 5.1 million to 8.5 million bpd, filling the gap left by Kuwaiti and Iraqi barrels and earning the margin on both the price increase and the volume increase simultaneously.
In 2026, the IRGC has triggered comparable price spikes and Iran captures zero incremental revenue, blocked by the US naval cordon effective April 13. The structural mirror to 1990 holds on the aggressor side: the party that causes the disruption earns nothing from it. But Saudi Arabia in 2026 cannot ramp. Its infrastructure is damaged, its export ceiling is physical, and the adversary’s escalation simultaneously raises the price Riyadh receives and constrains the volume Riyadh can ship. In 1990, Saudi Arabia earned the windfall on both axes — price and volume. In 2026, it earns it on one axis and loses it on the other.
The asymmetry has a number: $63 billion per year. That is the Yanbu-specific stranded revenue — oil that the East-West Pipeline can deliver to the port but that Yanbu’s berth infrastructure cannot load onto tankers. In 1990, the equivalent gap was zero — Saudi Arabia had the spare capacity to fill the market’s hole. In 2026, spare capacity exists on paper (the OPEC+ quota is 10.2 million bpd) but not in steel and concrete. The Yanbu bottleneck converts paper capacity into stranded revenue at a rate of roughly $172 million per day at current prices.
The Iran-Iraq Tanker War of 1984–1988 is the other precedent analysts reach for, but it maps poorly. Only 2 percent of ships passing through the Gulf were disrupted even at peak intensity, and global oil prices declined through the 1980s. The 2026 closure is near-total. The IRGC audio intercept from April 18 — “We will open it by the order of our leader, not by the tweets of some idiot” — suggests the closure is not negotiable at the operational level, whatever the diplomatic track in Islamabad produces or fails to produce.
What Does the $45 Gap Between Physical and Futures Brent Mean?
Physical Brent — dated cargoes for near-term delivery — reached $144.42 per barrel while futures settled at $99.36. The $45 spread prices two simultaneous realities: physical scarcity in the Atlantic basin and Indian Ocean, where pre-closure barrels are exhausting, and ceasefire-resolution expectations in forward curves, where traders price the probability that Hormuz reopens within 90 days.
The dislocation is not academic for Aramco. Saudi crude sold on term contracts is priced off the Oman/Dubai benchmark, which tracks physical rather than futures markets. The OSP premium of +$19.50 applies to a benchmark that has diverged sharply from the Brent futures price that dominates financial commentary. When the IEA or CNBC quotes “$99 Brent,” they are quoting the futures contract. When an Indian refiner calculates whether to lift a May cargo, the relevant number is closer to $130–140 for delivered physical barrels — a price at which the $19.50 OSP premium is not an inversion at all but a modest discount to physical market clearing levels.
The $45 spread also contains the market’s judgment on the IRGC’s credibility as an enforcer. Physical traders — the people who charter VLCCs and negotiate loading windows — are pricing a closed strait. Futures traders — the people who manage paper positions on ICE and NYMEX — are pricing a strait that reopens within one to three months. Both cannot be right. If the ceasefire collapses entirely after April 22, futures will converge upward toward physical. If Hormuz reopens, physical will collapse toward futures. For Saudi fiscal planning, the relevant question is which price is real. At 7.25 million bpd, the answer determines whether the deficit is $73 billion (Goldman’s current estimate at futures-derived prices) or something closer to $30–40 billion if physical prices hold and Aramco’s term contracts price off the higher benchmark.
Kevin Book of CSIS has described the dislocation in systemic terms: “If vessel traffic through the strait does not soon resume, the pinch will arrive, and supply will balance demand at a higher price.” The gap between physical and futures Brent is the market’s measure of how soon that pinch arrives. At $45, it is arriving now. A detailed examination of how the Dated Brent physical crude price reached $148.87 while fiscal models continued using $99 futures — and what that $49 spread means for Saudi Arabia’s break-even arithmetic — is in Saudi Arabia’s Real Oil Price May Be $50 Above Every Fiscal Model.
South Korea has activated a 100 trillion won ($68 billion) market stabilisation programme. Japan — 95 percent dependent on Gulf crude transiting Hormuz — has requested government stockpile releases. India raised its diesel export duty to ₹21.5 per litre. The demand response is real, but it is a response to physical prices, not futures prices, and the physical market is $45 ahead of the number in the headline.
The SAMA Reserve Runway
Saudi Arabia’s central bank, SAMA, held $434 billion in foreign reserve assets as of February 2026, down from $451 billion in January — a $17 billion monthly drawdown rate. At that pace, reserves reach approximately $360 billion by year-end 2026 and breach the $300 billion threshold — the level that triggered S&P and Fitch downgrades in 2016 — by mid-2027. Goldman Sachs estimates the reserve runway at approximately six years before reaching 2016 downgrade thresholds, but that estimate assumes current drawdown rates hold steady. They will not if the Yanbu ceiling persists.
The $9 Brent surge on April 18 slows the drawdown marginally. At $99 versus $90, the annualized revenue improvement of $23.8 billion translates to roughly $2 billion per month in reduced reserve erosion. That extends the runway by months, not years. It is the difference between breaching $300 billion in Q2 2027 and breaching it in Q4 2027 — a difference that matters to credit rating agencies on quarterly review cycles but does not alter the structural trajectory.
The $63 billion Yanbu stranded-revenue gap defines the fiscal paradox. Higher prices narrow it. They do not close it. The Yanbu ceiling ensures that no price available in the current market — including $144 physical Brent — fully compensates for the 3.15 million bpd of production Saudi Arabia has lost since February. The IRGC is involuntarily acting as a partial fiscal stabiliser, and “partial” is the word that carries the weight. The IRGC Navy’s declaration of “full authority” over Hormuz means the stabilisation continues only as long as the confrontation does — and only to the degree that Yanbu’s physical constraints allow Riyadh to capture it.
The ceasefire expires April 22. Iran has cancelled the April 20 Islamabad round. Ninety-six hours remain before the framework collapses entirely, and with it the forward curve’s residual expectation that Hormuz reopens on any defined timeline. If futures converge toward physical prices — $144 Brent — Saudi Arabia’s fiscal arithmetic improves substantially but still does not reach equilibrium at 7.25 million bpd. The paradox holds at every price the market can produce.
Frequently Asked Questions
What is Saudi Arabia’s current oil production and how does it compare to OPEC+ quotas?
Saudi production stands at 7.25 million bpd against an OPEC+ April quota of 10.2 million bpd — a gap of nearly three million bpd. The quota was set before Iranian strikes damaged Manifa, Khurais, and Ras Tanura, collectively cutting capacity by approximately 600,000 bpd. The remaining shortfall reflects voluntary restraint and logistical bottlenecks at Yanbu, where berth infrastructure cannot handle the full seven-million-bpd throughput of the restored East-West Pipeline.
How have VLCC shipping rates changed since the Hormuz closure?
VLCC day rates on the Middle East-to-China route reached $423,000 in late March 2026, the highest in data going back to 2005, according to Tankers International. War risk insurance premiums peaked above 5 percent of hull value per transit, per Lloyd’s List. Pre-closure, VLCC rates on the same route averaged $35,000–55,000 per day, meaning the war premium has multiplied shipping costs by roughly eight to twelve times for any cargo attempting Hormuz transit.
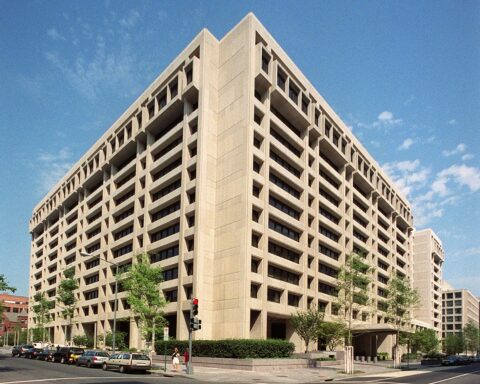
What is the difference between the IMF and Bloomberg fiscal break-even estimates for Saudi Arabia?
The IMF’s April 2026 World Economic Outlook places Saudi Arabia’s central-government-only fiscal break-even at $86.60 per barrel. Bloomberg Economics calculates a higher $108–111 figure by including $71 billion in PIF committed disbursements — capital outlays for NEOM, The Line, and other Vision 2030 megaprojects that flow through the sovereign wealth fund rather than the central budget but draw on the same hydrocarbon revenue base. The gap between the two numbers is effectively the price of Vision 2030.
Could Saudi Arabia expand Yanbu’s export capacity to bypass the Hormuz bottleneck?
Yanbu’s berth and loading infrastructure requires single-point mooring buoys, additional tank farm capacity, and deepwater channel dredging to handle more than its current 4–5.9 million bpd ceiling. Industry benchmarks for comparable port expansions — Fujairah in the UAE required 30 months for its 2019 expansion — suggest 18–36 months minimum, assuming wartime construction conditions do not introduce additional delays. No expansion has been publicly announced by Saudi Ports Authority or Aramco as of April 18, 2026.
Has Iran collected any revenue from its Hormuz toll programme?
Zero. In 36 days of operation, the IRGC-administered toll system has issued 60 permits and sent 8 payment requests, but no vessel or flag state has made a payment. The IMO Secretary-General Arsenio Dominguez has called the toll “illegal.” UNCLOS Article 26 prohibits charges on vessels exercising transit passage. The realistic annual revenue potential — estimated at $1–2 billion by Iranian economist Shokri — remains entirely theoretical, while Iran’s Central Bank has acknowledged 180 percent inflation and projected a 12-year economic recovery timeline.