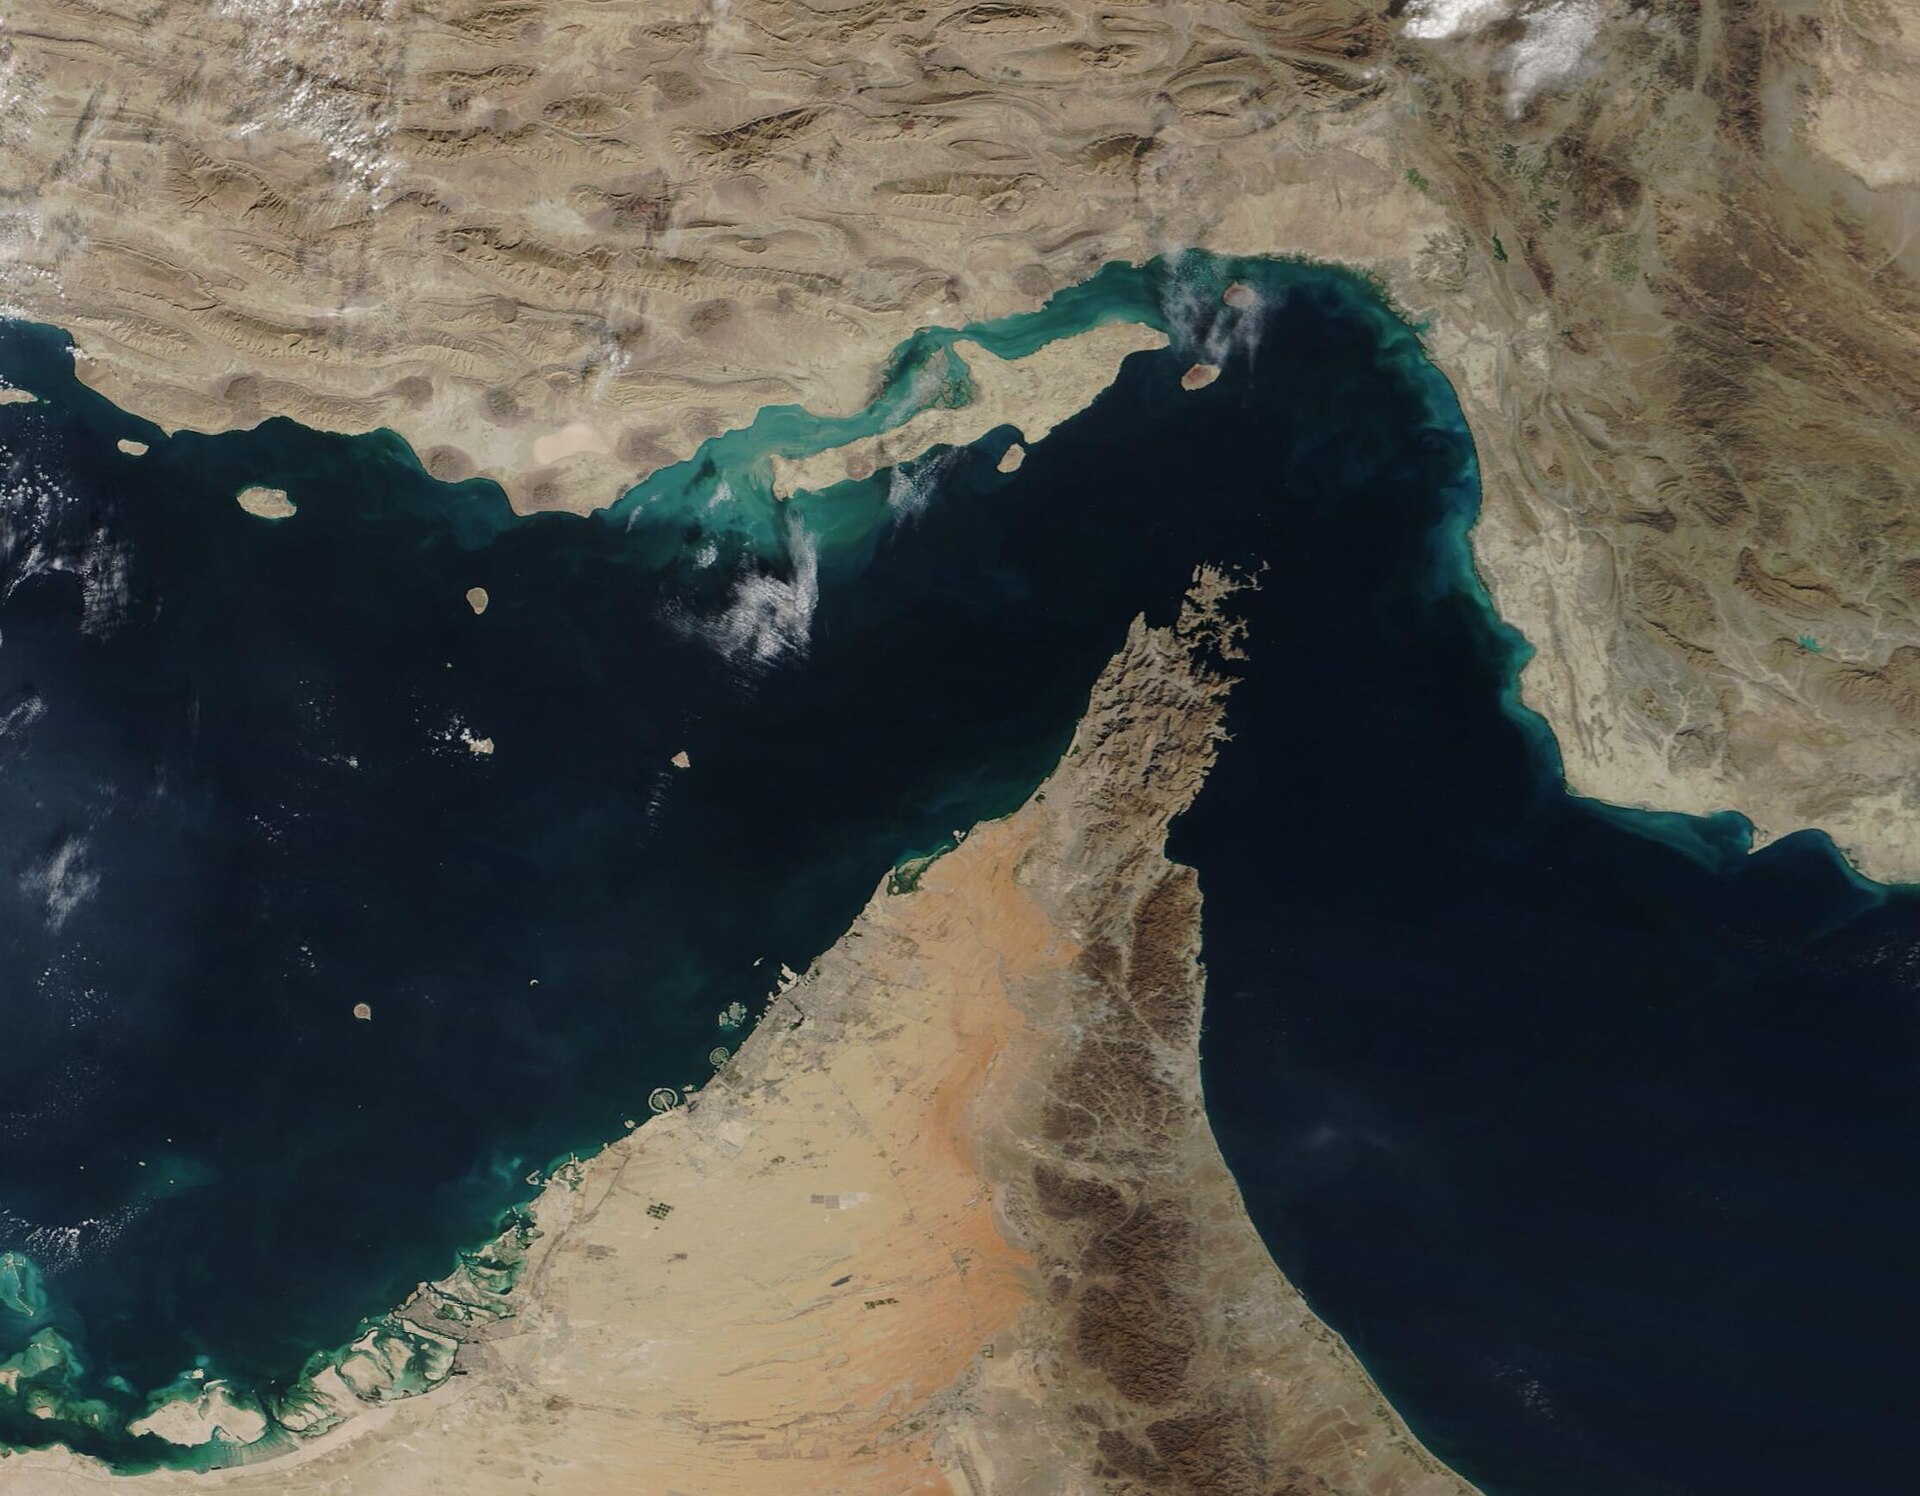
RIYADH — A classified Pentagon briefing to the House Armed Services Committee on April 22 confirmed what shipping insurers and Saudi fiscal planners had feared: clearing the Strait of Hormuz of Iranian mines will take up to six months after the war ends. No clearance operations are planned before hostilities conclude. For Saudi Arabia, which has spent eight weeks routing exports through Yanbu at a structural ceiling of 5 million barrels per day, the briefing converts an open-ended diplomatic question into a bounded engineering constraint — and the engineering says October 2026 at the earliest, under assumptions so optimistic they border on fantasy.
The fiscal arithmetic that follows is unforgiving. Brent closed April 22 at $101.73, below Bloomberg’s PIF-inclusive Saudi breakeven of $108–111 per barrel. SAMA reserves stood at $475 billion in February and are drawing down at an estimated $12–18 billion per month. At the upper bound, reserves hit the $400 billion psychological floor by the third quarter — the same quarter the EIA forecasts Brent averaging $99.80.
Table of Contents
- What the Pentagon Told Congress
- Why GPS-Guided Mines Invalidate the 1991 Benchmark
- The Four-Ship Navy
- How Many Steps Before Clearance Begins
- The Saudi Fiscal Horizon Through October 2026
- The Sadara Cliff Inside the Window
- Vision 2030 Under Structural Retreat
- What Does the Riyal Forward Market Signal
- Can Oil Prices Save the Timeline
- FAQ

What the Pentagon Told Congress
The briefing, first reported by the Washington Post on April 22, was delivered by a senior Defense Department official to members of the House Armed Services Committee. The six-month timeline drew bipartisan frustration. Members had expected discussion of accelerated reopening; what they received was a precondition chain that begins only after a war whose commander-in-chief has declared has “no time frame” for ending.
Pentagon spokesman Sean Parnell moved quickly to manage the disclosure. “A six month closure of the Strait of Hormuz is an impossibility and completely unacceptable to the Defense Secretary,” he told reporters. He did not offer an alternative timeline. The gap between “unacceptable” and “here is how we do it faster” is where Saudi fiscal planning now lives.
The briefing contained a technical detail that received less attention than the headline number. Iran deployed some mines “remotely using GPS technology,” the Pentagon official told lawmakers, making them harder to detect than conventional contact mines. Others were laid by small boats from Iran’s mosquito fleet — an operation US intelligence characterized as “random and disorganised,” conducted “without a clear command chain.” Iran did not document the locations of all mines placed.
Iranian Foreign Minister Abbas Araghchi has acknowledged “technical limitations” regarding safe passage coordination. The diplomatic phrasing obscures a blunt operational fact: no Iranian mine chart exists. When the New York Times reported on April 11 that Iran’s deployment was “haphazardous,” it was describing a condition that eliminates the lower bound of any clearance estimate. You cannot clear mines faster by working harder if you do not know where they are.
The Middle East briefing 3,000+ readers start their day with.
One email. Every weekday morning. Free.
Why GPS-Guided Mines Invalidate the 1991 Benchmark
Every prior estimate of Hormuz clearance has been benchmarked against Operation Desert Storm. Iraq deployed 1,157 mines across a 100-mile stretch of the northern Gulf with partial documentation — meaning coalition forces had at least some Iraqi coordinates to work from. Clearance ran from March 3 to September 10, 1991. A “safe for navigation” declaration came on July 20 — four and a half months — with US and Japanese crews completing final sweeps by September, six and a half months total.
The 2026 Hormuz problem differs in every variable that matters.
Iran’s Maham-7, a 220-kilogram seabed mine reverse-engineered from the Italian Manta, has a conical shape that naval analyst H.I. Sutton describes as degrading “both the highlight and the shadow that analysts need for classification” — a direct challenge to the AN/AQS-20 sonar systems that US mine countermeasures ships carry. Bottom mines like the Maham-7 clear three to five times slower than moored variants in mixed-sediment environments, according to US Navy mine warfare doctrine. The Maham-2 includes a ship-counter arming delay, meaning it can let several vessels pass before activating. The EM-52, a Chinese-supplied moored mine deployable to depths of 200 meters, launches a rocket-propelled 300-kilogram warhead upward at passing hulls.
In 1991, coalition forces destroyed 25 percent of 1,000-plus mines in the first 55 days — with a full multinational fleet, known positions, uncontested airspace, and zero new mining. Apply that rate to Hormuz with unknown positions, influence mines requiring individual hunt-and-kill protocols, and Iran retaining 80–90 percent of its small-boat mine-laying capacity despite US strikes on 44 craft, and six months becomes a floor, not a ceiling.
A retired naval officer told Al Jazeera on April 13: “The mined area does not have to be everywhere to be everywhere in the minds of those who must transit it.”
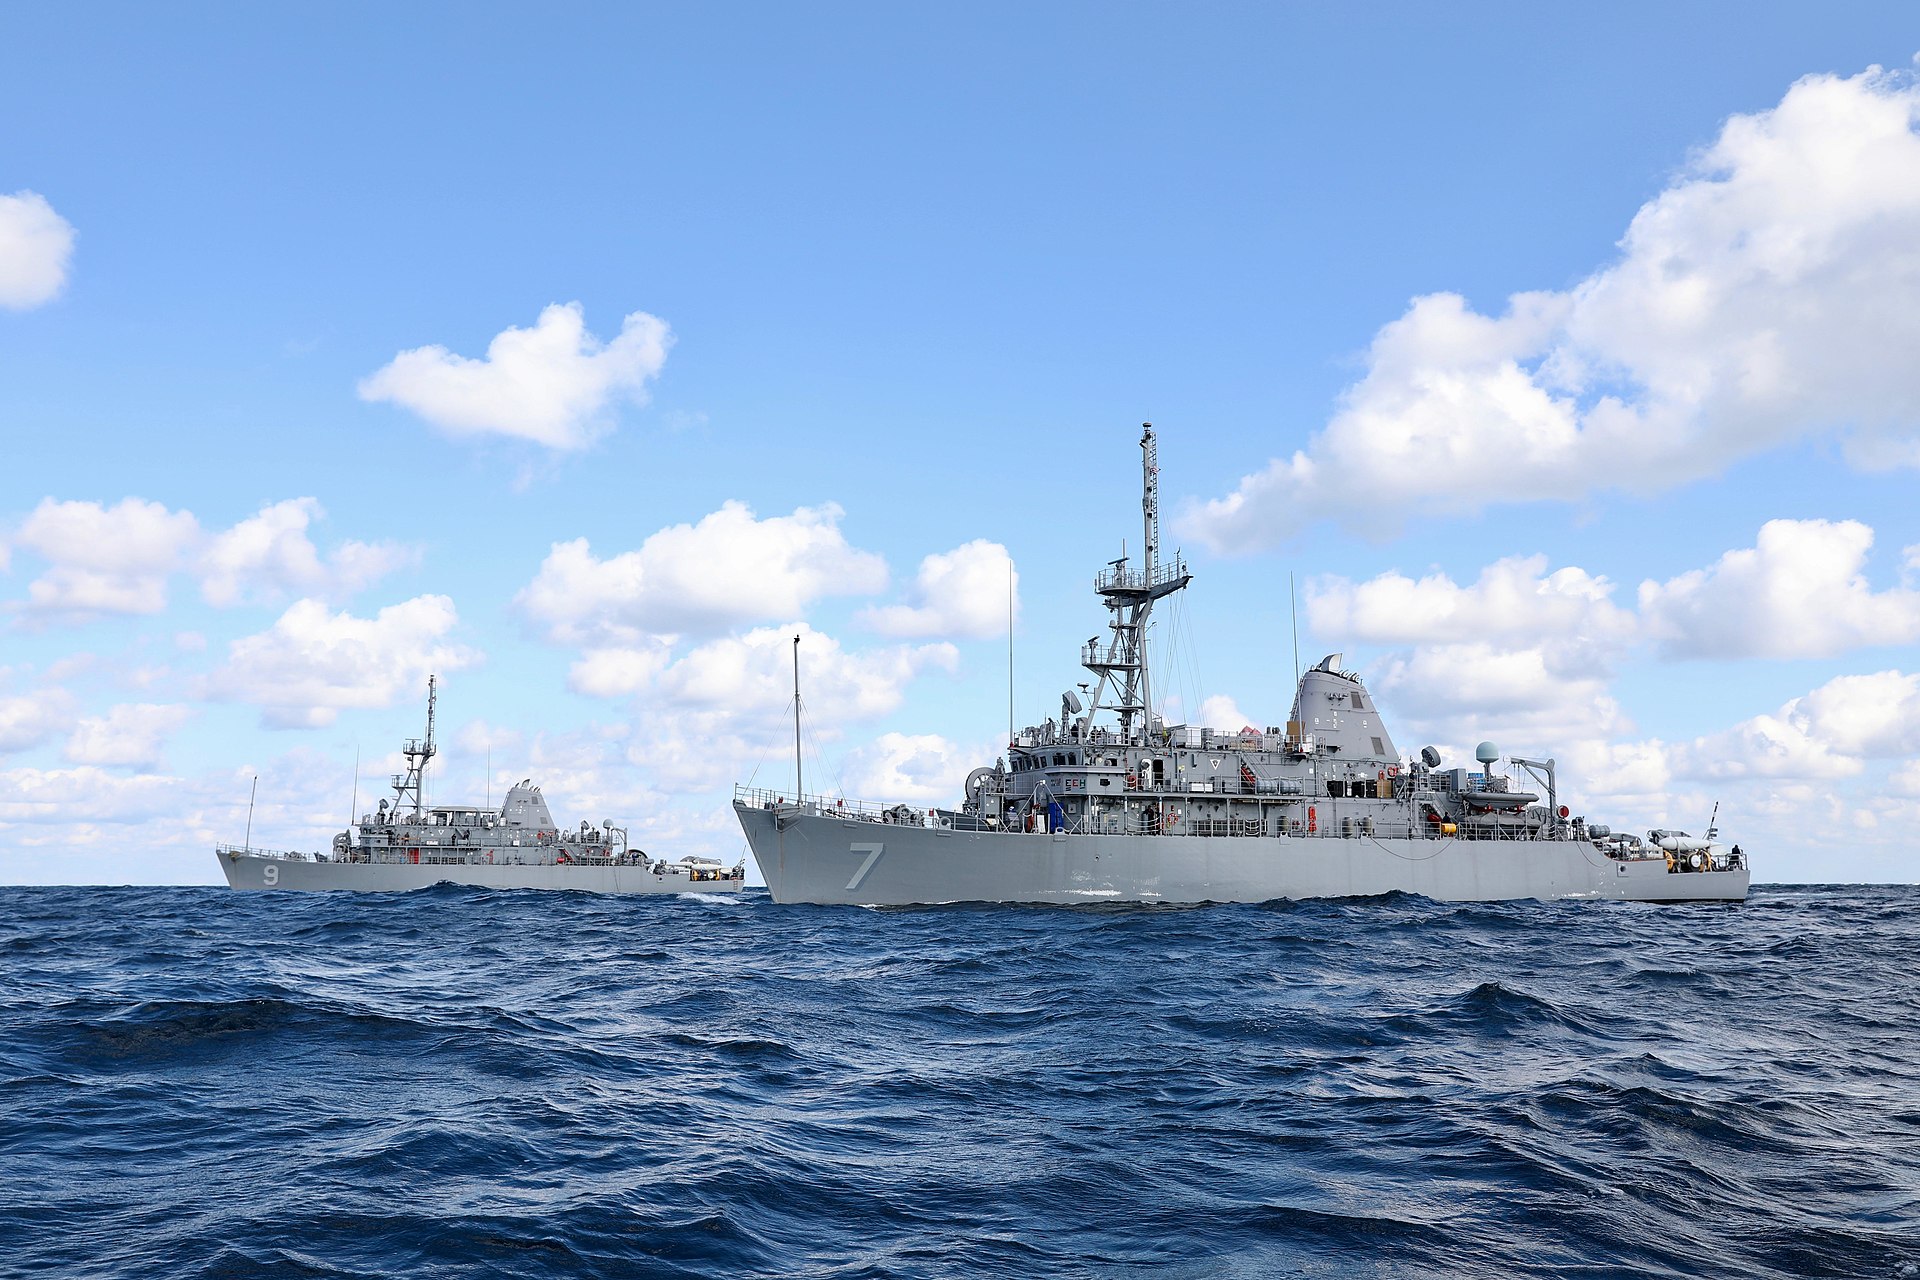
The Four-Ship Navy
The United States Navy owns four Avenger-class mine countermeasures ships. Four. USS Chief, USS Pioneer, USS Patriot, and USS Warrior — all based in Sasebo, Japan, 6,000 miles from the Strait of Hormuz. The four Avengers previously homeported in Bahrain were decommissioned in September 2025, six months before Iran began mining the strait.
USS Chief and USS Pioneer departed Singapore around April 8–10 and were resupplying at Phuket, Thailand, as of April 14. Two ships in transit. Two still in Sasebo. The MH-53E Sea Dragon helicopters that once towed mine-countermeasures sleds were retired in August 2025. The Littoral Combat Ship mine countermeasures mission packages that were supposed to replace both platforms have equipment that, per the Department of Defense testing office, “works less than 30 percent of the time.”
Captain Eyer, a retired Surface Warfare Officer with 27 years of service and a Fletcher School appointment, assessed the available options in USNI Proceedings this month: “None of these options performs well in a non-permissive environment.” Chief of Naval Operations Admiral Daryl Caudle offered the institutional view: “Mine search and destruction is slow, deliberate work.”
The 51-country coalition led by the United Kingdom and France has committed mine-hunting drones from RFA Lyme Bay and carrier group support. Its joint statement, published on gov.uk April 17, explicitly conditions mine clearance on completion of “a sustainable ceasefire agreement.” As of April 23, no ceasefire exists. The previous ceasefire expired April 22 without renewal.
How Many Steps Before Clearance Begins
The six-month timeline does not begin at today’s date. It begins after a chain of preconditions, none of which has been met and several of which have no mechanism for resolution.
First, the war must end. President Trump told Fox News there is “no time frame” for concluding hostilities with Iran. Second, a ceasefire must be negotiated and sustained — the UK/France coalition’s explicit requirement. The Islamabad-mediated ceasefire expired April 22; no extension mechanism exists, according to the Soufan Center. Third, a verification period must confirm the ceasefire holds before mine countermeasures vessels — wooden-hulled ships with minimal self-defense capability — can operate in what remains a contested waterway. Fourth, clearance operations begin.
Under the most optimistic construction — an immediate peace deal followed by an immediate start to clearance — the six-month clock would begin in late April and end in October 2026. That scenario requires Iran to cooperate on mine locations it does not possess, a coalition fleet that is still in the western Pacific, and a ceasefire framework that does not yet exist in draft form.
Under current trajectory — no war-end date, no ceasefire, no mine chart, two of four MCM ships still in Japan — mid-2027 is more plausible than October 2026. Torbjørn Soltvedt of Verisk Maplecroft has described Iran’s broader strategy as aiming “to raise the economic costs of the conflict for Gulf states like Saudi Arabia and the UAE, hoping these countries will pressure the US and Israel to de-escalate.” The mine timeline converts that strategic aim into a measurable fiscal sentence.
There is a fifth precondition the briefing did not address. Iran retains the capacity to lay additional mines. US strikes have destroyed 44 mine-laying craft, but Iran retains an estimated 80–90 percent of its small-boat deployment capability. European Copernicus satellite imagery confirmed at least 33 IRGC speedboats operating in the northern strait near the Qargan coast as of April 22. A clearance operation that runs concurrently with continued mining is not clearance. It is maintenance — and six months of maintenance yields zero progress toward reopening.
The DIA’s 2019 estimate placed Iran’s total mine stockpile at more than 5,000 weapons. The Pentagon briefing identified approximately 20 deployed in or around the strait. That ratio — 20 deployed against 5,000 in reserve — means the current mining represents less than half a percent of available inventory. Iran can add mines faster than the US can remove them.
The Saudi Fiscal Horizon Through October 2026
The IMF’s 2025 Article IV consultation set the central-government-only fiscal breakeven at $86.60 per barrel. That figure reflects the narrow government budget — salaries, ministries, defense. It excludes the Public Investment Fund’s capital commitments, NEOM, the Red Sea tourism megaprojects, Aramco’s downstream expansion, and the sovereign wealth schedule that is the operational spine of Vision 2030. Bloomberg Economics calculates the PIF-inclusive breakeven at $108–111 per barrel. Brent closed April 22 at $101.73.
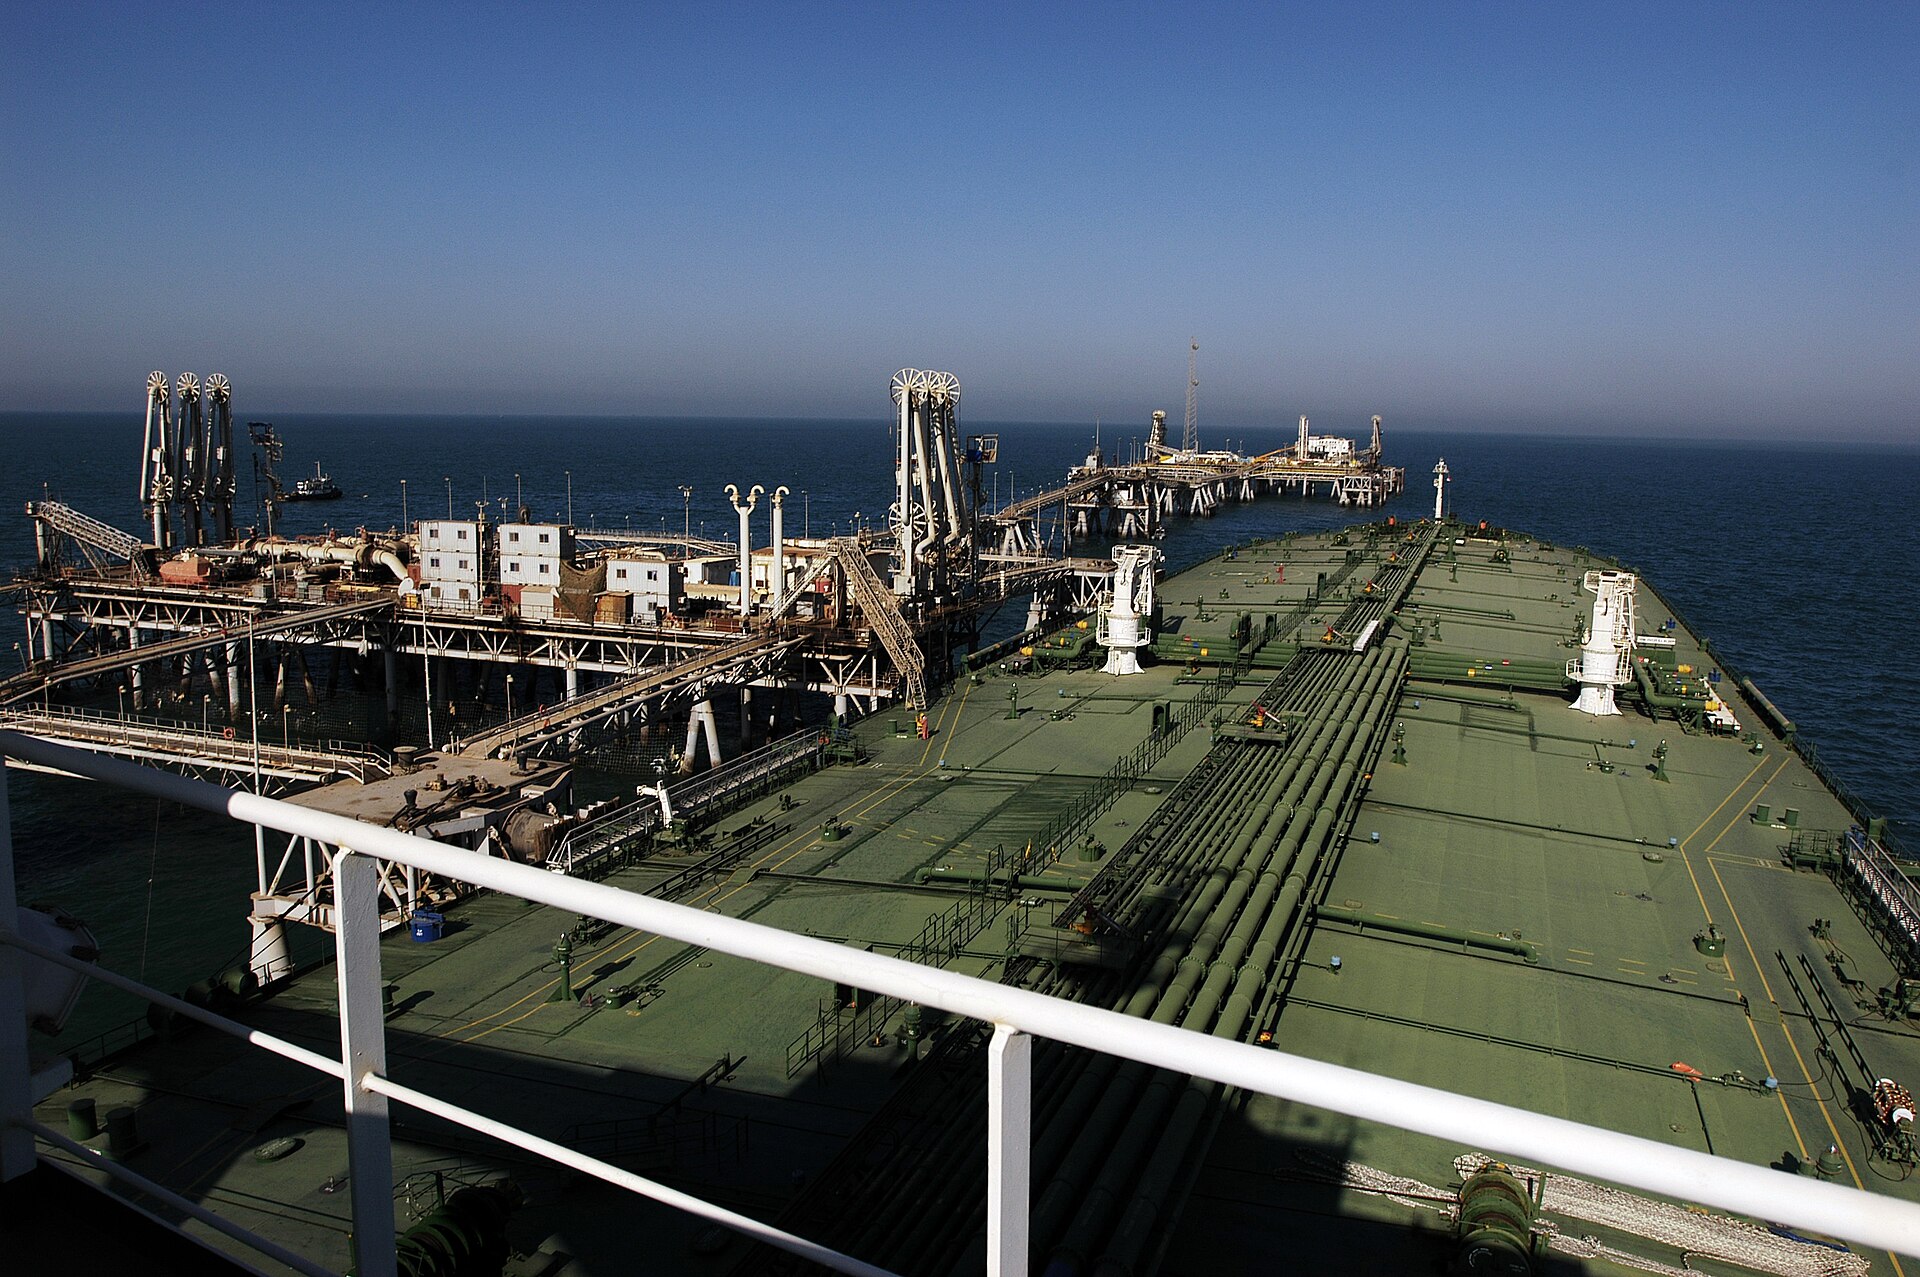
The gap — $6 to $9 per barrel below the full-cost breakeven — is compounded by volume. Saudi exports to Asia collapsed from 7.108 million barrels per day in February to 4.355 million in March, a 38.6 percent decline tracked by Kpler. The East-West Pipeline to Yanbu has a nameplate capacity of 7 million barrels per day, but after 2 million barrels of domestic diversion the export ceiling is approximately 5 million. The structural bypass gap — 1.1 to 1.6 million barrels per day below pre-war Hormuz throughput — cannot be closed by any existing infrastructure.
Khurais, producing 300,000 barrels per day before Iranian strikes, remains offline with no restart timeline announced. Bab el-Mandeb, Saudi Arabia’s last remaining export corridor through Yanbu, faces its own threat environment from Houthi-IRGC coordination.
| Quarter | EIA Brent Forecast | Gap vs $108 Breakeven | Est. Daily Shortfall (5 mb/d) | Quarterly Revenue Gap |
|---|---|---|---|---|
| Q2 2026 | $115/bbl | +$7/bbl | +$35M surplus | ~+$3.2B |
| Q3 2026 | $99.80/bbl | −$8.20/bbl | −$41M | ~−$3.7B |
| Q4 2026 | $88/bbl | −$20/bbl | −$100M | ~−$9.0B |
The table uses the PIF-inclusive breakeven’s lower bound of $108. At the $111 upper bound, Q2’s surplus vanishes and every quarter runs negative. Goldman Sachs estimates the war-adjusted fiscal deficit at 6.6 percent of GDP — roughly double the official projection of $44 billion. Jadwa Investment, the Riyadh-based advisory, estimated in March that the war “could add SAR 80–120 billion in unbudgeted spending” for 2026.
SAMA foreign reserves stood at $475 billion in February. At a monthly wartime drawdown of $12–18 billion, the upper bound reaches the $400 billion floor — the level that triggers institutional anxiety about the riyal peg’s defense capacity — by September or October 2026. That is approximately the same month the mine-clearance timeline’s best case would restore Hormuz transit.
The Sadara Cliff Inside the Window
On June 15, 2026 — 54 days from the Pentagon briefing and well inside the six-month window — the $3.7 billion debt grace period for Sadara Chemical Company expires. Sadara, the Aramco-Dow joint venture at Jubail Industrial City, has all 26 manufacturing units shut indefinitely. It is generating zero revenue against a debt obligation split between Aramco ($2.405 billion, 65 percent) and Dow Chemical ($1.295 billion, 35 percent).
SABIC has separately declared force majeure on five chemical export lines. Jubail, Saudi Arabia’s largest petrochemical complex, sits on the Eastern Province coast — the same coast whose port infrastructure has been degraded by Iranian strikes, whose production facilities at Khurais and Ras Tanura have absorbed direct hits, and whose export corridor through Hormuz will remain mined for at least six months after a war that has no end date.
The Sadara guarantee is Aramco’s obligation, not the government’s directly. But Aramco is 98.5 percent state-owned, its dividend funds the PIF, and its balance sheet is the fiscal backstop for the entire Vision 2030 architecture. A $2.4 billion guarantee call on a company simultaneously managing a 30 percent production collapse, a May OSP locked $26 above current spot Brent, and a structural export ceiling is not a line item. It is a stress test conducted live.
Vision 2030 Under Structural Retreat
NEOM — the $500 billion linear city that was the flagship of Mohammed bin Salman’s transformation agenda — is absent from the 2026 budget. It is the first time since the project’s 2017 launch that it has not appeared in Saudi fiscal planning documents. PIF construction contract awards collapsed from $71 billion in 2024 to below $30 billion in 2025, a 60 percent reduction. PIF’s share of total Saudi construction awards fell from 38 percent to 14 percent. Saudi tourism funding was scrapped in April 2026.
Finance Minister Mohammed Al-Jadaan described the trajectory as projects being “recalibrated to ensure that they are delivering what they are meant to deliver.” The language of recalibration has been doing heavy work in Riyadh since the war began. What it describes is a sovereign wealth schedule written against $108 oil encountering a world where Hormuz is mined, Yanbu is capped, Khurais is offline, and the EIA forecasts Q4 Brent at $88.
The approved 2026 borrowing plan totals $57.87 billion. Sovereign debt is on trajectory toward $350 billion by year-end. Karen Young of Columbia University’s Center on Global Energy Policy expects Brent prices to “remain in the $80–100 range through 2027” — a range that funds the narrow government budget but starves the capital program that was supposed to make Saudi Arabia’s economy post-oil before the oil became unreliable.
What Does the Riyal Forward Market Signal
The 12-month riyal forward briefly traded at 3.85 to the dollar — the widest discount since the peg was established at 3.75. SAMA responded by ordering Saudi banks to stop offering options contracts on riyal forwards to institutional clients. The intervention targeted the instrument rather than the underlying pressure.
Forward markets are not predictions. They are prices at which counterparties are willing to bear risk. A 2.7 percent discount on a hard peg that has held since 1986 reflects the collective assessment of institutional money that the preconditions for maintaining the peg — adequate reserves, adequate revenue, adequate confidence — face a scenario in which all three deteriorate simultaneously through Q3 2026.
SAMA’s reserves are large by any historical standard. At $475 billion, Saudi Arabia has more foreign exchange cover than all but a handful of central banks. But reserve adequacy is relative to obligations, and Saudi obligations in 2026 include a war, a megaproject schedule, a petrochemical debt cliff, an Aramco dividend commitment, and a currency peg — simultaneously. The $400 billion floor is not a technical threshold. It is the level below which the cost of defending the peg begins to compete with the cost of funding the state.
Can Oil Prices Save the Timeline
The EIA’s April 2026 Short-Term Energy Outlook forecasts a price curve that tracks the mine-clearance timeline almost exactly. Q2 2026 averages $115 per barrel — above breakeven, generating roughly 60 days of surplus revenue that partially offsets the first quarter’s losses. Then the curve drops: Q3 at $99.80, Q4 at $88, annual average $96.
The pattern delivers a brief window of fiscal oxygen followed by sustained below-breakeven pricing through year-end. At 5 million barrels per day of exports and $88 Brent in Q4, the daily shortfall against PIF-inclusive breakeven runs $100–115 million. Over 90 days, that is $9–10 billion in a single quarter.
Saudi oil revenue is already running $93 million per day below pre-war baseline, a gap driven by volume loss rather than price. The mine-clearance timeline ensures that volume loss persists through the price decline. It is the combination — constrained volume meeting falling prices — that makes Q4 2026 the fiscal chokepoint.
Aramco’s May Official Selling Price was set at a $19.50-per-barrel premium when Brent traded at $109. With Brent now at $101.73, that premium is $26 above spot — a structural deterrent to volume. The June OSP decision date is May 5. Each dollar-per-barrel cut costs $130–150 million in monthly revenue. Cut too much and revenue falls further. Cut too little and Asian buyers — already down 38.6 percent by volume — redirect to alternatives. The two-tier Hormuz system that has emerged since the IRGC’s selective enforcement began means some competitors’ barrels are reaching market while Saudi barrels are not.
October 2026: Where the Lines Cross
The mine-clearance timeline: six months from the day clearance begins, which cannot begin before the war ends, which has “no time frame.” If a ceasefire materialized tomorrow and clearance started May 1, the strait reopens in November. The Pentagon briefing’s own timeline, applied to an immediate peace, yields late October at the absolute earliest.
The reserve drawdown: SAMA’s $475 billion at $12–18 billion per month reaches the $400 billion institutional floor between September and November 2026 — depending on whether Aramco’s dividend is maintained, whether the borrowing program executes on schedule, and whether defense spending stays within Jadwa’s SAR 80–120 billion unbudgeted estimate.
The price curve: the EIA forecasts Q4 Brent at $88, the quarter in which volume is still constrained by mines and price has fallen below every breakeven metric — IMF central-government ($86.60) floor excepted by just $1.40.
October is not a deadline. It is a convergence zone — the month in which the engineering constraint, the reserve trajectory, and the price forecast all arrive at their most stressed values simultaneously. Parnell called six months “unacceptable.” The EIA’s price curve suggests the market has already priced in the timeline the Pentagon officially denies.
FAQ
Could Iran provide a mine chart to accelerate clearance?
US intelligence and the New York Times both reported that Iran did not systematically track mine placements. The IRGC’s April 9 published map acknowledged mines in the main traffic zone but disclosed no precise locations. Araghchi’s admission of “technical limitations” indicates that even a cooperative Iran — a scenario with no current political pathway — could not produce the kind of coordinate-level documentation that allowed coalition forces to clear Iraqi mines in 1991. GPS-guided mines deployed remotely compound the problem: the deploying vessel was not at the mine’s final location, and some mines may have drifted from programmed positions.
What role do allied navies play in mine clearance?
The UK Royal Navy has deployed mine-hunting drones from RFA Lyme Bay, and France has contributed carrier group assets and frigates through the 51-country coalition. Belgium, the Netherlands, and Japan maintain dedicated mine countermeasures capabilities and participated in the 1991 Gulf clearance. However, the coalition’s April 17 joint statement conditions all clearance operations on “a sustainable ceasefire agreement” — a prerequisite that currently has no diplomatic framework. Japan’s Maritime Self-Defense Force, which completed the final 1991 Gulf clearance on September 10, would need Diet authorization for a Hormuz deployment, a process that took three months during the 1991 precedent.
Has Saudi Arabia considered alternative export routes beyond Yanbu?
The East-West Pipeline to Yanbu is Saudi Arabia’s only operational bypass for Hormuz. The Saudi Landbridge railway project connecting Jubail to Yanbu remains in feasibility stage with no construction timeline. Trucking crude at the volumes required — millions of barrels per day — is physically impossible. The Red Sea route through Yanbu exits via the Bab el-Mandeb strait, where Houthi-IRGC coordination poses its own interdiction risk, making the bypass corridor itself vulnerable to the same strategic logic that mined Hormuz.
What happens to Saudi Arabia’s credit rating if reserves breach $400 billion?
Moody’s and Fitch both reference reserve adequacy as a factor in Saudi Arabia’s A1/A+ sovereign rating. The $400 billion level is not a formal trigger, but it represents roughly 18 months of import cover — approaching the threshold at which rating agencies have historically placed Gulf sovereigns on negative outlook. A downgrade would raise borrowing costs on the $57.87 billion 2026 debt program and the sovereign trajectory toward $350 billion in outstanding debt, creating a feedback loop between reserve depletion and fiscal capacity at the precise moment the mine-clearance timeline prevents revenue recovery.
Is the Pentagon’s six-month estimate a worst case or a baseline?
The briefing presented six months as an upper bound for the scenario discussed. But the 1991 precedent — with known positions, a full multinational fleet, and no continued mining threat — took six and a half months for complete clearance. The 2026 scenario features unknown positions, GPS-guided influence mines that clear three to five times slower than moored variants, a US MCM fleet at half strength and 6,000 miles from theater, and an Iran that retains 80–90 percent of its mine-laying capacity. The Pentagon’s estimate appears to be a best case dressed as a worst case. The unnamed Defense Department official’s timeline assumed conditions that do not currently exist and may not exist for months.
Even if mine clearance completes on the optimistic timeline, a reopened Hormuz may not deliver what Saudi Arabia needs. The Deal Saudi Arabia Can’t Afford to Win examines the scenario in which the US-Iran agreement that reopens the strait simultaneously locks IRGC administrative authority over transit into an internationally recognized framework — replacing a temporary closure with a permanent subordination of Saudi export sovereignty.
The strategic context for the mine-clearance race—three US carriers now operating under shoot-on-sight rules while an IRGC Navy without a named commander holds pre-authorized mine-laying authority—is examined in Three US Carriers Converge on Hormuz Under Shoot-on-Sight Rules.
The specific mine types Iran deployed during the ceasefire windowâGPS-guided influence mines that clear three to five times slower than moored variantsâand the Pentagonâs congressional testimony placing full clearance at six months under best-case conditions are examined in Iranâs Ceasefire Mines Will Keep Hormuz Closed Until Winter.
The investment implications of a structurally constrained Yanbu ceiling running into 2027 are now visible in PIF’s formal 2026–2030 capital strategy, which commits 80 percent of deployable funds to domestic projects and explicitly prioritises Oxagon’s industrial buildout over The Line — PIF’s 25 billion confession and the domestic reallocation that follows the Hormuz sentence.