
{“content”: “
REPLACED OK
n
DHAHRAN u2014 At $114 per barrel, Brent crude sits three dollars above Saudi Arabia’s fiscal break-even and three dollars below the level at which the IMF and World Bank project the global economy tips toward recession. The band in which Saudi fiscal survival and post-oil ambitions can coexist is seven dollars wide.
n
The fiscal arithmetic becomes more complex once Aramco’s own earnings structure is accounted for. Q1 2026 is expected to show a 57 percent profit surge to $29 billion u2014 generated on 30 percent less oil, at war-elevated prices that the June OSP reset has already begun to unwind. The Q2 cliff that follows is the mechanism through which $114 Brent translates into a Saudi budget shortfall rather than a surplus.
The Middle East briefing 3,000+ readers start their day with.
One email. Every weekday morning. Free.
n
The IEA projects global oil demand will contract by 80,000 barrels per day in 2026 u2014 an 810,000 bpd swing from the growth forecast in March and the first annual decline since the pandemic. JPMorgan estimates demand has already fallen 4.3 million bpd since the war began. The economies absorbing that contraction are the same ones whose spending, investment, and travel Vision 2030 was designed to capture: G7 consumers, Asian manufacturers, Gulf tourism source markets. Iran’s May 4 drone strike on the Fujairah oil terminal u2014 the UAE’s sole Hormuz bypass u2014 pushed Brent to $114.44, placing it directly inside the World Bank’s worst-case scenario band of $115 per barrel average for 2026.
n
Table of Contents
n
- n
- The Revenue Illusion at 7.25 Million Barrels per Day
- How Wide Is the Band Between Fiscal Survival and Demand Destruction?
- What Does $114 Oil Do to the Economies Vision 2030 Depends On?
- Where Does Petrochemical Demand Destruction Leave NEOM?
- Iran’s Bypass-Elimination Doctrine
- Can Saudi Arabia Pump Its Way Out?
- What Does the 1973 Demand-Destruction Lag Mean for 2027?
- Frequently Asked Questions
- n
n
n
n
n
n
n
n
n
n
n
n
The Revenue Illusion at 7.25 Million Barrels per Day
n
The arithmetic looks favorable. At 7.25 million bpd and $114 per barrel, Saudi Arabia generates approximately $826 million in daily gross crude revenue. Before the war, at 10.4 million bpd and $72 Brent, the figure was $748 million per day. Goldman Sachs estimates the net weekly revenue increase at roughly 10 percent u2014 a calculation that has led some analysts to characterize the conflict as fiscally profitable for Riyadh.
n
The favorable reading does not survive contact with the volume data. Saudi Arabia’s 30 percent single-month production collapse u2014 from 10.4 million bpd in February to 7.25 million bpd in March, according to the IEA u2014 was not a voluntary OPEC+ adjustment. It was war damage, Hormuz closure, and pipeline destruction compressing output to a level Saudi infrastructure cannot quickly reverse. The IEA characterized the broader disruption as “the largest in the history of the global oil market,” with global supply falling 10.1 million bpd to 97 million bpd in March.
n
Brent has risen approximately 78 percent since January 1, 2026, when it traded near $64, and roughly 60 percent since the war began on February 28 at $72. The trajectory is not linear u2014 Brent collapsed from $109 to $91.70 on April 8 when the East-West Pipeline strike triggered a demand-collapse repricing, then recovered above $100 by late April before the Fujairah attack pushed it past $114. Each recovery has been driven by supply elimination; each pullback by demand destruction reasserting itself against the supply premium.
n
Aramco’s own pricing desk has registered the doubt. The May Official Selling Price carried a war premium of +$19.50 per barrel above benchmark u2014 set when Brent traded above $109. The June OSP reset to +$3.50, a $16 per barrel markdown in a single month.
n
CNN Business reported on May 1 on the structural gap between expected and actual prices: “Prices aren’t as high as they should be, considering the historic destruction of the world’s oil supply… Oil was supposed to be at $150 by now, according to analysts’ expectations at the outset of the war.” The distance between $150 and $114 is demand destruction u2014 4.3 million barrels per day of it, by JPMorgan’s calculation. That shortfall represents the global economy absorbing the shock rather than transmitting it directly into futures prices.
n

n
How Wide Is the Band Between Fiscal Survival and Demand Destruction?
n
Seven dollars. Saudi Arabia’s PIF-inclusive fiscal break-even sits at $108u2013111 per barrel according to Bloomberg, and the World Bank’s worst-case scenario projects Brent averaging $115 in 2026. At 7.25 million bpd, each dollar below $108 costs approximately $7.25 million per day against break-even; each dollar above $115 deepens recession probability in Saudi Arabia’s target export and investment markets.
n
| Brent Price | Daily Revenue | vs. Break-Even ($108) | Market Signal |
|---|---|---|---|
| $105 | $761M | -$21.75M/day | Fiscal deficit accelerates |
| $108 | $783M | Break-even floor | PIF commitments at risk |
| $111 | $805M | +$21.75M/day | Minimal fiscal headroom |
| $114 | $826M | +$43.5M/day | Current price u2014 World Bank worst-case zone |
| $115 | $834M | +$50.75M/day | World Bank worst-case threshold |
| $120 | $870M | +$87M/day | IMF “close call for global recession” |
n
Goldman Sachs estimates the Kingdom’s war-adjusted fiscal deficit at $80u201390 billion, against an official projection of $44 billion reflecting 3.3 percent of GDP. The gap reflects military procurement, infrastructure repair, and the PIF spending commitments that Bloomberg’s break-even calculation captures but the official budget does not. The Goldman estimate implies that the +10 percent weekly revenue gain is consumed entirely by war costs, with no net improvement in fiscal position relative to pre-war conditions.
n
At $114, daily revenue of $826 million produces approximately $43.5 million per day above the $108 floor u2014 roughly $15.9 billion annualized if both price and production hold. Saudi output has been subject to week-by-week variation since March, driven by pipeline repair cycles, Yanbu loading constraints, and weather disruptions at Red Sea terminals. The annualized surplus is a mathematical projection, not a realized figure.
n
The IMF’s April 14 World Economic Outlook placed the worst-case global growth rate at 2.0 percent for 2026 and 2027, with inflation exceeding 6 percent u2014 what the Fund characterized as “a close call for a global recession.” Brent at $114.44 on May 4 sits inside the price band that the IMF associates with that outcome.
n
What Does $114 Oil Do to the Economies Vision 2030 Depends On?
n
Vision 2030’s revenue diversification model depends on three external demand sources: G7 tourism spending, Asian manufacturing investment, and global FDI flows. The IMF’s worst-case scenario projects global growth falling to 2.0 percent in 2026 u2014 a level reached only four times since 1980. None of those demand sources was on target before the war. The domestic-side paradox — how April’s PMI rebound to 51.5 actually intensifies fiscal pressure rather than relieving it by expanding state subsidy and transfer obligations against a structurally capped export base — is the subject of Saudi Arabia’s Economy Is Recovering. That Is the Problem.
n
All three demand sources are contracting. Energy input costs u2014 LPG, naphtha, jet fuel, diesel u2014 have risen sharply since February 28 and are running through transport, manufacturing, and consumer prices across the G7 and Asian markets that generate the FDI, tourism, and trade flows Vision 2030 was designed to capture.
n
The FDI gap was structural before the war. At 1.9 percent of GDP, inflows ran 3.1 percentage points below Vision 2030’s target u2014 a deficit that predated the war by years, reflecting regulatory constraints, labor market restrictions, and competition from the UAE and Bahrain for the same pool of international capital. War-era geopolitical risk premiums have widened the gap further, though no post-February FDI data has been published by the Saudi General Authority for Statistics. The gap predates the conflict; the conflict removes any plausible timeline for closing it by 2030.
n
PIF construction contract awards provide the most direct measure of megaproject momentum. Awards fell from $71 billion in 2024 to under $30 billion in 2025 u2014 a 60 percent reduction, according to Middle East Briefing data. PIF’s own share of those awards dropped from roughly 38 percent to 14 percent. The private-sector co-investment that Vision 2030’s economic model requires as a multiplier is retreating faster than PIF’s own spending.
n
Saudi Arabia scrapped dedicated Vision 2030 tourism funding on April 16, pivoting to what Skift characterized as “event-driven demand” organized around Expo 2030 Riyadh and FIFA 2034. Investment Minister Khalid Al Falih confirmed at the PIF Private Sector Forum in February that these events are now the Kingdom’s most protected investment channels. Both require international travel markets, corporate sponsorship budgets, and consumer discretionary spending from the G7 and Asian economies where LPG consumption has fallen 13 percent (India), European airlines are warning of jet fuel shortages, and Asian plastics factories are cutting production or shutting down entirely.
n
IEA Executive Director Fatih Birol characterized the disruption as “the biggest energy security threat in history” with “13 million barrels per day offline.” That supply destruction propagates into the tourism and hospitality sectors Saudi Arabia has designated as post-oil revenue foundations. The Skift analysis of the April 16 pivot identified the Kingdom’s shift from steady-state tourism development to intermittent mega-event demand, concentrating risk on two events scheduled four and eight years apart.
n

n
Where Does Petrochemical Demand Destruction Leave NEOM?
n
The IEA reports petrochemical feedstock demand 1.5 million barrels per day below February forecasts by Q2 2026, with naphtha down 450,000 bpd and LPG/ethane down 320,000 bpd. These are the deepest sectoral declines in the current cycle, concentrated in China and Asia u2014 the manufacturing economies NEOM’s Oxagon industrial city was designed to serve as a downstream processing hub.
n
Oxagon’s investment thesis positioned Saudi Arabia as both feedstock supplier and manufacturing platform for Asian export markets. The Juaymah LPG terminal shutdown on May 3 removed a primary feedstock source. The 770,000 bpd of combined naphtha and LPG demand contraction has closed the Asian end simultaneously.
n
The broader NEOM complex reflects the same contraction. The Line u2014 the 170-kilometer linear city that served as NEOM’s flagship u2014 was suspended in January 2026. Population targets have been revised from 1.5 million to under 300,000 by 2030. Only 2.4 kilometers of foundation work has been completed. The $10 billion DSV logistics partnership, cited as Oxagon’s primary anchor tenant commitment, remains “not operational, no capital allocated” as of Q1 2026, per ENR reporting.
n
PIF Governor Al-Rumayyan has since made the pivot explicit. His April statement formally abandoned The Line’s 2030 residential targets and named Oxagon as the only NEOM deliverable u2014 confirming that PIF’s 2026u20132030 strategy treats Oxagon’s industrial port function, not the flagship linear city, as the project’s residual investment case.
n
PIF Governor Yasir Al-Rumayyan addressed the retrenchment in April: “No project in NEOM has been cancelled… Re-evaluation of priorities happens all the time… but the presence of war increases the pressure to reposition some priorities.” The distinction between cancellation and indefinite repositioning operates at the level of internal PIF governance. It does not operate at the level of the international contractors, suppliers, and co-investors whose capital NEOM’s financial model requires u2014 and whose risk appetite the IEA’s feedstock demand data measures in real time at 1.5 million bpd below plan.
n
Iran’s Bypass-Elimination Doctrine
n
Iran’s targeting pattern since March follows a single operational logic: eliminate every route by which Gulf crude reaches international markets without transiting the Strait of Hormuz.
n
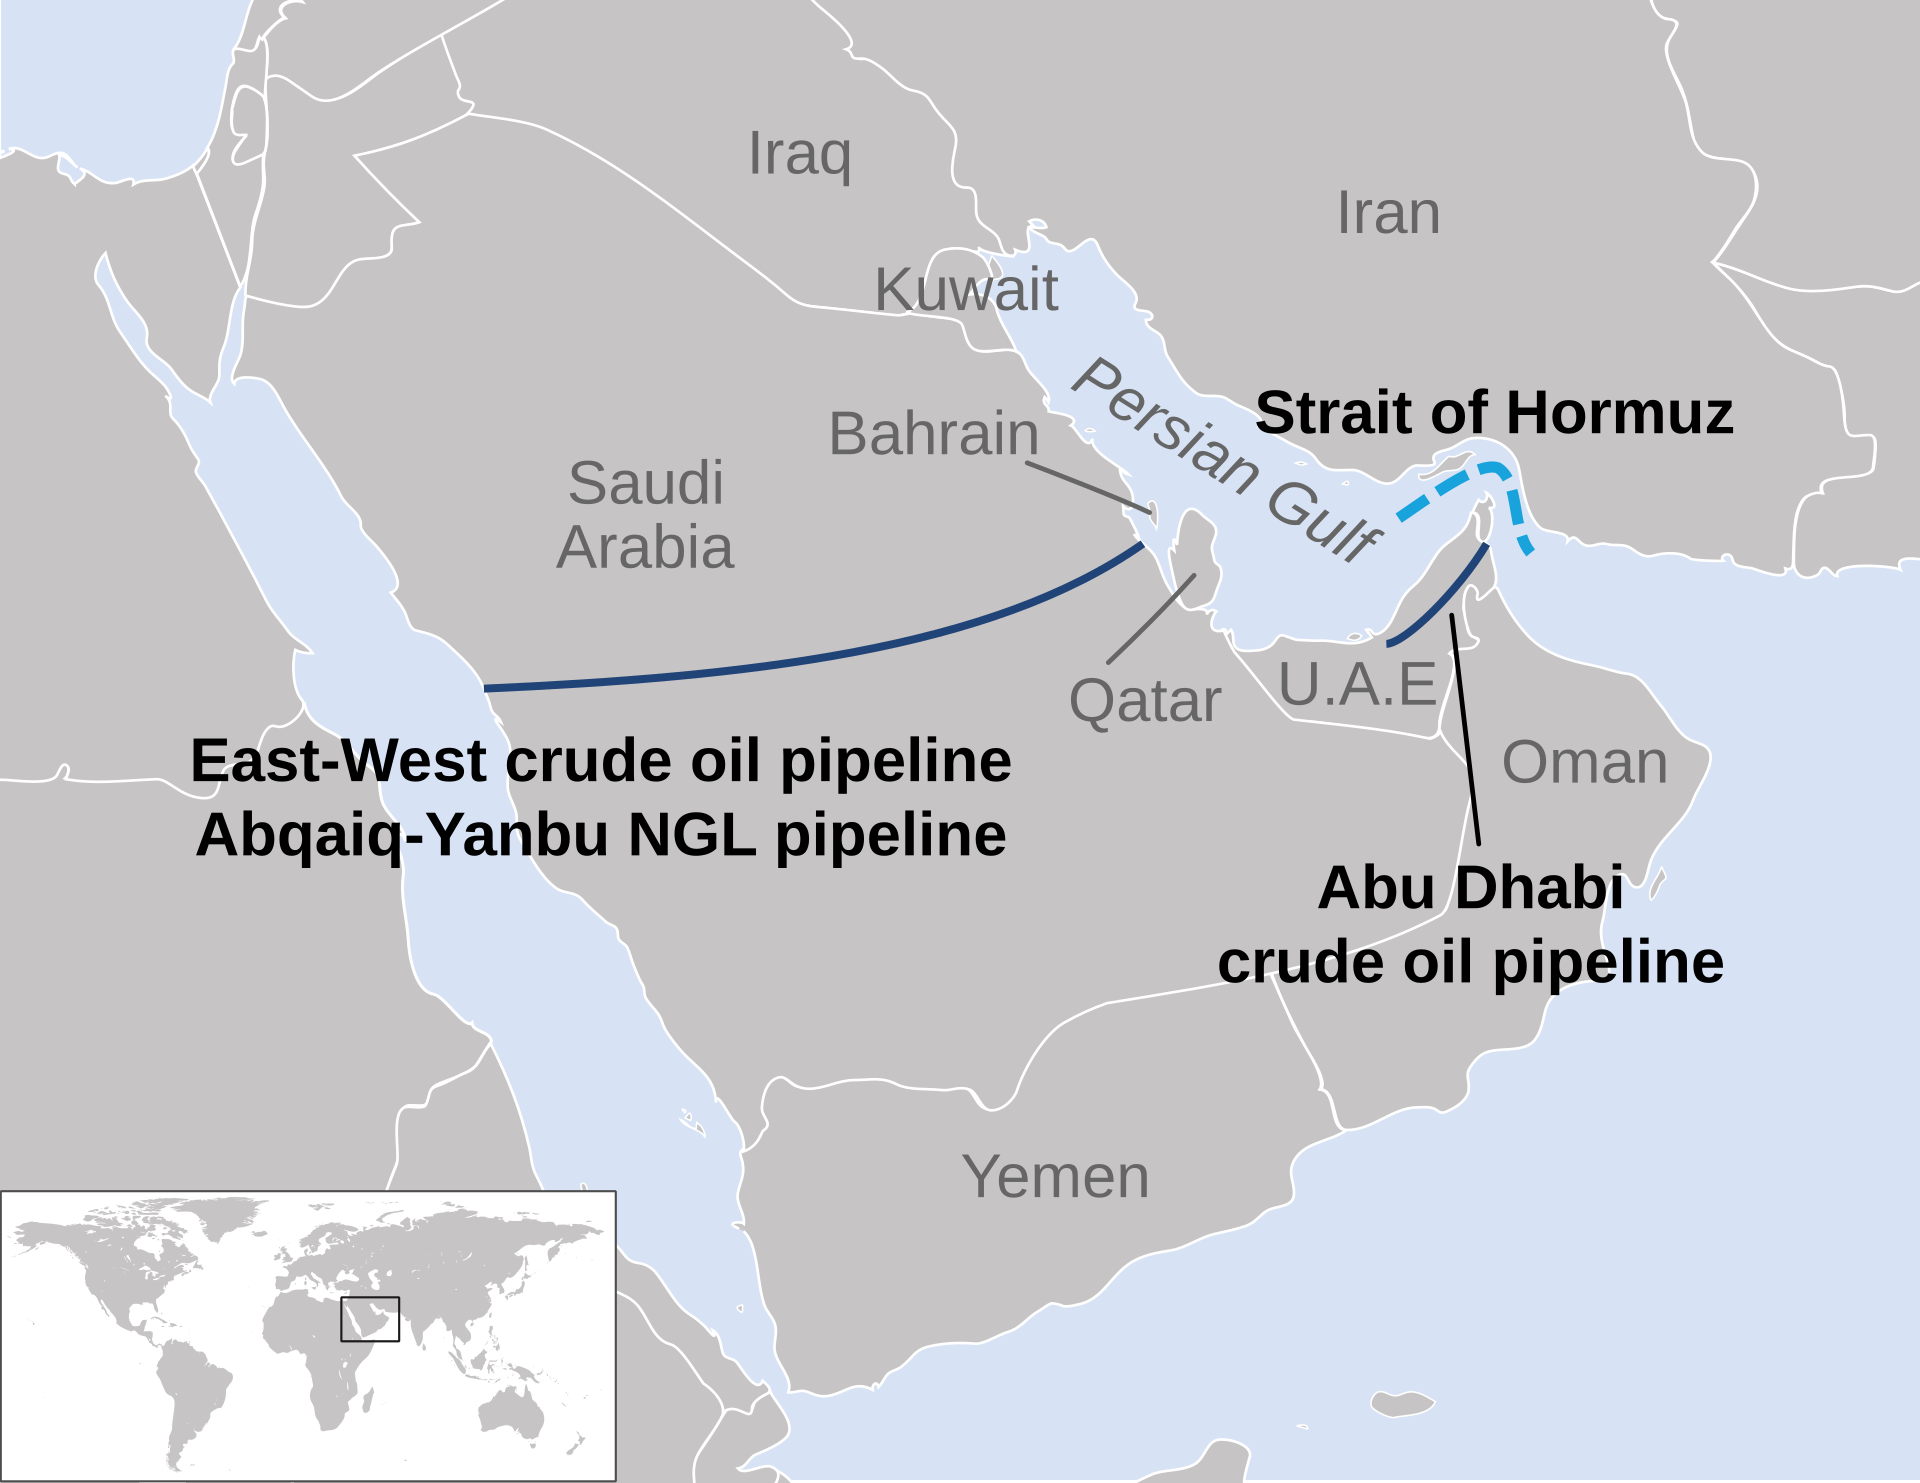
On April 8, IRGC forces struck a pumping station on the East-West Pipeline, the 1,200-kilometer conduit connecting Saudi Arabia’s Eastern Province oil fields to the Red Sea port of Yanbu. The pipeline carries a nominal capacity of 7 million bpd and constitutes Saudi Arabia’s sole Hormuz bypass. Brent dropped from $109.27 to $91.70 in a single session u2014 a $17.57 decline reflecting the market’s initial assessment that demand collapse, not supply tightening, would define the next price phase.
n
On May 4, Iran struck the VTTI oil terminal at Fujairah with drones, on the same day the Trump administration launched its “Project Freedom” naval convoy through the Strait. Fujairah is the terminus of the Abu Dhabi Crude Oil Pipeline (ADCOP), the UAE’s sole Hormuz-bypass export route with approximately 1.5 million bpd of capacity. Brent spiked roughly 5 percent on the news. A second Iranian strike followed on May 5, completing what a detailed account of Iran’s thirty-day bypass denial campaign traces as a three-part sequence: East-West Pipeline on April 8, Fujairah terminal on May 4, and the IRGC maritime control zone declared over the Gulf of Oman approaches simultaneously.
n
With the East-West Pipeline damaged and Fujairah struck, the only functioning bypass outlet is Yanbu u2014 capped at approximately 5.9 million bpd, against pre-war Hormuz throughput of 7u20137.5 million bpd. The structural deficit is 1.1u20131.6 million bpd even at full operational capacity.
n
The Fujairah strike carries a secondary strategic function. With the UAE outside OPEC as of May 1 and pursuing an independent production strategy, the attack simultaneously punishes the cartel defector and eliminates the bypass that would have allowed non-Saudi Gulf producers to route around the Hormuz double blockade. All market pressure now concentrates on the Yanbu ceiling as the only functioning Gulf export outlet.
n
The bypass-elimination pattern holds a pricing logic beyond the operational objective. At $114, Iran maximizes economic disruption to G7 consumers and Asian importers while keeping Saudi Arabia dependent on a price floor that Iranian supply restriction controls. The $110u2013$120 band appears to be the operational range: high enough to lock in Saudi fiscal dependency on war-era pricing, not so high as to trigger demand collapse severe enough to erode oil’s geopolitical value entirely. Iran’s parliament is advancing a 12-article bill asserting sovereign regulatory authority over all Hormuz transits u2014 a measure that would embed the blockade in domestic law rather than treat it as wartime posture subject to ceasefire reversal.
n
n
Can Saudi Arabia Pump Its Way Out?
n
No. Yanbu u2014 Saudi Arabia’s only functioning Hormuz-bypass export terminal u2014 has a maximum throughput of approximately 5.9 million barrels per day. Khurais field is producing 300,000 bpd below capacity with no restoration timeline announced, and the East-West Pipeline remains damaged. Effective export capacity sits below even the Yanbu ceiling.
n
OPEC+ members collectively produced 27.68 million bpd in March against a quota of 36.73 million bpd u2014 a war-driven shortfall of roughly 9 million bpd, per Bloomberg data. The remaining seven OPEC members approved a +188,000 bpd output increase for June, a figure amounting to less than 0.7 percent of actual March production and less than 0.2 percent of the quota target. Saudi Arabia now operates an OPEC designed for voluntary supply management under conditions of involuntary supply destruction. Aramco’s production level is determined by infrastructure capacity, not by market strategy u2014 the cartel’s output-management mechanism cannot influence price in either direction.
n
Wood Mackenzie assessed the structural shift: “Saudi Arabia is now left doing more of the heavy lifting on price stability, and the market loses one of the few shock absorbers it had left.” Helima Croft of RBC Capital Markets observed that meaningful spare capacity is “almost exclusively concentrated in Saudi Arabia and the UAE.” With the UAE outside the cartel, Saudi Arabia bears the full burden of any coordinated supply response on infrastructure that cannot physically deliver the volumes the market requires.
n
The first “Project Freedom” Hormuz convoy on May 4 moved tankers through the Strait under US naval escort, but convoy operations impose speed, scheduling, and escort-availability constraints that prevent them from matching pre-war transit volumes. Roughly 21 million bpd moved through Hormuz daily before the war. Iran’s state news agency IRNA dismissed the convoy as “part of [Trump’s] delirium.”
n
What Does the 1973 Demand-Destruction Lag Mean for 2027?
n
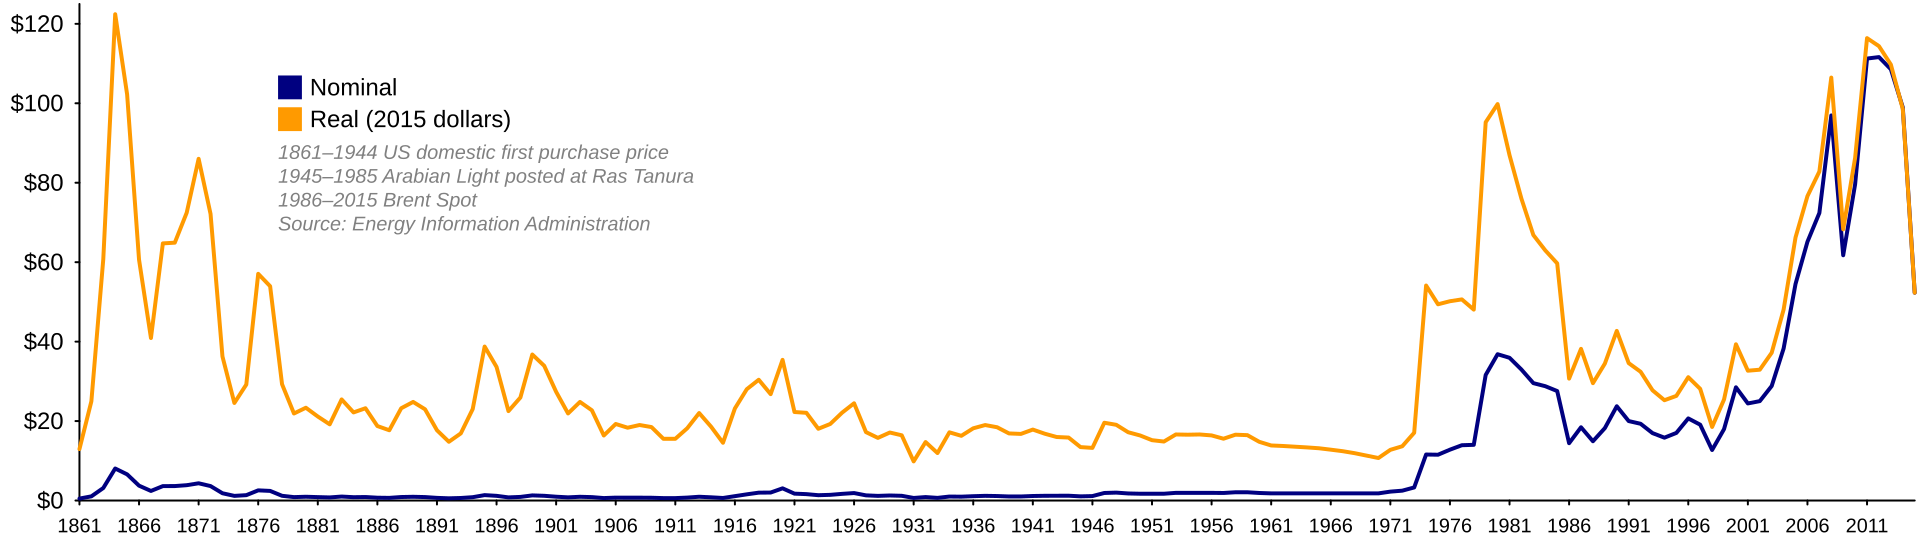
The 1973 embargo’s demand destruction took 12u201318 months to fully materialize after the price spike peak. Applied to the current shock, the full structural demand-side adjustment arrives in late 2026 or 2027 u2014 when the fiscal windfall appears most established and the economic damage has not yet registered in Saudi planning assumptions.
n
The precedent is precise in its mechanics. Oil quadrupled from $2.90 to $11.65 per barrel by January 1974. US real GDP fell 2.1 percent in 1974; UK GDP dropped approximately 3.9 percent. The price spike appeared resolved within weeks as embargo conditions eased, but the recession triggered by the demand adjustment deepened through mid-1975. Federal Reserve History and Baker Institute analyses document the same pattern: demand destruction is a lagging indicator, visible 6u201318 months after the price peak and arriving when the supply-side crisis appears solved.
n
The current shock differs from 1973 in a way that worsens the lag’s fiscal impact. In 1973, the price spike was driven by an embargo u2014 a voluntary supply restriction that could be reversed when political objectives were achieved. In 2026, the disruption is involuntary and structural, driven by infrastructure damage requiring months of repair and a mine-clearance operation that the IEA has not included in any near-term supply recovery scenario. The demand-destruction lag will overlap with a period in which supply recovery remains physically impossible, compressing the fiscal band from both directions.
n
The 1981u201386 Iran-Iraq War offers an even more direct structural template, with the variables inverted. During that conflict, Saudi Arabia voluntarily reduced production from roughly 10 million bpd to 2.5 million bpd over four years to defend the OPEC price floor. MERIP’s assessment of the result: “Saudi net oil revenue fell almost to zero as it cut production ever further in defense of price. Finally nearly broke, the Saudis initiated a dramatic production increase” u2014 crashing prices to $10 per barrel by 1986 and contributing to conditions that forced Khomeini to accept the 1988 ceasefire.
n
In 2026, the structure is identical but the direction is reversed. Saudi Arabia has not voluntarily cut production; war damage and the Hormuz blockade imposed it. The Kingdom receives a price windfall rather than fiscal collapse. But the constraint is the same: volume cannot increase above the Yanbu ceiling of 5.9 million bpd without Hormuz reopening, which requires a ceasefire, which requires resolution of the IRGC’s internal command authority u2014 a variable Riyadh cannot influence and Washington has failed to resolve through direct engagement at Islamabad.
n
The 1986 capitulation u2014 the moment Riyadh abandoned price defense, flooded the market, and crashed oil to $10 per barrel u2014 is not available in 2026. That option requires spare capacity to release. In 1981, Saudi Arabia entered the price-defense trap with 10 million bpd to cut from; by the time the trap closed four years later, it had reached 2.5 million bpd. In 2026, Saudi Arabia entered the trap already at 7.25 million bpd with an export ceiling of 5.9 million bpd through Yanbu, and no volume instrument to deploy.
n
The physical crude market already reflects the gap between headline pricing and delivery reality. IEA data shows North Sea Dated cargo trades reaching near $150 per barrel while Brent futures sit at $114 u2014 a physical-futures disconnect of roughly $36 per barrel. The futures market prices in a ceasefire probability that the physical market, where actual barrels must load onto actual ships for actual delivery, does not share. If the 1973 lag applies, the demand destruction that currently holds Brent at $114 rather than $150 deepens through 2027 u2014 compressing the price ceiling lower while the fiscal floor remains fixed at $108u2013111 per barrel.
n
n
Frequently Asked Questions
n
What is Saudi Arabia’s current daily oil revenue compared to pre-war levels?
n
At 7.25 million bpd and $114 per barrel, Saudi Arabia generates approximately $826 million per day in gross crude revenue, against $748 million pre-war at 10.4 million bpd and $72 Brent. Goldman Sachs estimates the net weekly increase at roughly 10 percent. This figure does not account for the June OSP markdown’s downstream effects: physical delivery contracts signed at the May OSP of +$19.50 per barrel are now approximately $17 per barrel underwater against current spot prices. Asian customers account for the majority of Saudi crude liftings; at that price differential, the pressure on cargo scheduling and realized settlement prices is structural. The gap between gross and realized revenue is Aramco’s problem before it becomes the Ministry of Finance’s problem, but the trajectory of the two converges by Q3.
n
Why does the World Bank’s worst-case scenario match the current Brent price?
n
The World Bank’s April 28 Commodity Markets Outlook modeled a worst-case Brent average of $115 per barrel for 2026, conditional on further infrastructure damage. Iran’s May 4 Fujairah strike fulfilled that condition within a week of publication. The Bank’s base-case projection remains $95u2013100 per barrel, predicated on a ceasefire holding and Hormuz reopening by Q3 2026. North Sea Dated physical cargoes trading near $150 suggest the physical market assigns a substantially lower probability to that ceasefire timeline than the World Bank assumes. The base case requires resolution of the IRGC’s authorization ceiling, Hormuz mine clearance, and pipeline repair u2014 three conditions that have no established timeline as of May 4.
n
The fiscal pressure these oil-price dynamics place on Riyadh has triggered a structural reorientation of PIF’s 2026–2030 investment strategy. PIF’s 80/20 domestic investment strategy examines how $92 billion is being redirected from international markets to domestic deployment as a direct consequence of the wartime revenue collapse.
n
What happens to Expo 2030 and FIFA 2034 if oil stays above $110?
n
Expo 2030 Riyadh carries an official budget of $7.8 billion, a projected economic impact of SAR 355 billion, and an attendance target of 40u201342 million visitors. Both Expo and FIFA 2034 are the Kingdom’s most protected investment channels, per Investment Minister Al Falih’s February confirmation at the PIF Private Sector Forum. Sustained oil above $110 does not threaten the construction budgets u2014 PIF can fund these from current revenue u2014 but it threatens the attendance and commercial revenue models. A global recession triggered by prolonged energy costs above $110 would suppress international travel and consumer spending in the G7 and Asian markets that generate the majority of mega-event visitors. The 2022 Qatar World Cup drew 1.4 million international visitors; Saudi Arabia’s 2034 attendance models require multiples of that figure from economies facing the IMF’s 2.0 percent growth scenario.
n
Why can’t a ceasefire resolve the fiscal paradox?
n
A ceasefire would reopen Hormuz, restore Saudi production capacity toward pre-war levels, and lower Brent toward the pre-war $72 range u2014 creating a different fiscal crisis. At 10.4 million bpd and $72 per barrel, daily revenue returns to $748 million, below the $108u2013111 break-even that includes PIF spending commitments. Post-war reconstruction costs would push the effective break-even higher still. Hormuz mine clearance alone u2014 estimated at 200 square miles based on the 1991 Kuwait benchmark u2014 would take approximately 51 days under optimal conditions. Only two Avenger-class mine countermeasure vessels remain in theater following the decommissioning of four from Bahrain in September 2025, extending the practical clearance timeline well beyond the technical estimate. Full Hormuz transit restoration under any ceasefire is a months-long process, not a weeks-long one. The fiscal cost of that constrained timeline is now on the books: Saudi Arabia’s Q1 2026 budget data shows SR125.7 billion ($33.5B) in deficit against a SR165B full-year forecast — 76% of the annual target consumed before the calendar turned to April.
n”}