
PHP Warning: Trying to access array offset on false in /var/www/html/wp-content/plugins/postman-smtp/Postman/PostmanOAuthToken.php on line 45
Warning: Trying to access array offset on false in /var/www/html/wp-content/plugins/postman-smtp/Postman/PostmanOAuthToken.php on line 45
PHP Warning: Trying to access array offset on false in /var/www/html/wp-content/plugins/postman-smtp/Postman/PostmanOAuthToken.php on line 46
Warning: Trying to access array offset on false in /var/www/html/wp-content/plugins/postman-smtp/Postman/PostmanOAuthToken.php on line 46
PHP Warning: Trying to access array offset on false in /var/www/html/wp-content/plugins/postman-smtp/Postman/PostmanOAuthToken.php on line 47
Warning: Trying to access array offset on false in /var/www/html/wp-content/plugins/postman-smtp/Postman/PostmanOAuthToken.php on line 47
PHP Warning: Trying to access array offset on false in /var/www/html/wp-content/plugins/postman-smtp/Postman/PostmanOAuthToken.php on line 48
Warning: Trying to access array offset on false in /var/www/html/wp-content/plugins/postman-smtp/Postman/PostmanOAuthToken.php on line 48
PHP Warning: Undefined array key “SERVER_NAME” in /var/www/html/wp-content/plugins/postman-smtp/Postman/Postman-Mail/PostmanDefaultModuleTransport.php on line 37
Warning: Undefined array key “SERVER_NAME” in /var/www/html/wp-content/plugins/postman-smtp/Postman/Postman-Mail/PostmanDefaultModuleTransport.php on line 37
PHP Warning: The magic method OCDI\OneClickDemoImport::__wakeup() must have public visibility in /var/www/html/wp-content/themes/fox/fox/inc/admin/import/demo-import/inc/OneClickDemoImport.php on line 128
Warning: The magic method OCDI\OneClickDemoImport::__wakeup() must have public visibility in /var/www/html/wp-content/themes/fox/fox/inc/admin/import/demo-import/inc/OneClickDemoImport.php on line 128
PHP Warning: foreach() argument must be of type array|object, null given in /var/www/html/wp-content/themes/fox/fox/inc/admin/import.php on line 298
Warning: foreach() argument must be of type array|object, null given in /var/www/html/wp-content/themes/fox/fox/inc/admin/import.php on line 298
WordPress database error You have an error in your SQL syntax; check the manual that corresponds to your MySQL server version for the right syntax to use near ‘%rank_math_sitemap%’ at line 1 for query DELETE FROM wp_options WHERE option_name LIKE %rank_math_sitemap% made by include(‘phar:///usr/local/bin/wp/php/boot-phar.php’), include(‘phar:///usr/local/bin/wp/vendor/wp-cli/wp-cli/php/wp-cli.php’), WP_CLI\bootstrap, WP_CLI\Bootstrap\LaunchRunner->process, WP_CLI\Runner->start, WP_CLI\Runner->load_wordpress, require(‘wp-settings.php’), do_action(‘init’), WP_Hook->do_action, WP_Hook->apply_filters, WP_CLI\Runner->{closure}, wp_update_post, wp_insert_post, do_action(‘save_post’), WP_Hook->do_action, WP_Hook->apply_filters, hos_clear_rankmath_sitemap_cache, hos_do_clear_sitemap_cache
PHP Warning: Constant DONOTCACHEPAGE already defined in /var/www/html/wp-content/mu-plugins/setup-33500.php on line 14
Warning: Constant DONOTCACHEPAGE already defined in /var/www/html/wp-content/mu-plugins/setup-33500.php on line 14
HOS setup-33500: category set to 145, cache cleared.
DHAHRAN — Brent crude has fallen 40% from its 2026 conflict peak to $75.49 per barrel while not a single commercial tanker has transited the Strait of Hormuz. The oil market has priced in an Iranian supply resumption that remains physically impossible for Saudi Arabia — whose exports are blocked by naval mines for an estimated 40 to 180 more days — creating a structural inversion in which the kingdom absorbs the full price collapse before recovering a single export barrel.
Saudi Arabia now faces a $32–36 per barrel gap between market price and its $108–111 fiscal breakeven, translating to roughly $160–175 million in lost revenue per day. When Saudi crude eventually resumes flowing through Hormuz, it will price into a market already repriced downward by the anticipation of Iranian barrels that have not yet arrived either. The mechanics of that inversion run across six dimensions: the price signal, the physical blockade, the fiscal damage, the insurance barrier, the PGSA fee layer, and the precedent set by similar episodes in 2015–16 and 2011.
Contents
- The Price Moved Before the Barrels
- How Far Has Brent Fallen From Its Conflict Peak?
- Mines, Not Markets, Control the Timeline
- How Long Will Mine Clearance Take?
- The Fiscal Damage Is Already Locked In
- Why Can’t Tankers Transit Even If Mines Are Cleared?
- The Fee Saudi Arabia Pays on Its Own Exports
- Can Iran Deliver the Barrels Markets Have Priced In?
- The JCPOA Precedent: Eighteen Months of Phantom Supply
- What Does Triple Compression Mean for Saudi Revenue?
The Price Moved Before the Barrels
In a functioning commodity market, a supply deal benefits the exporting country once the supply comes online. The sequence runs: agreement, then production, then price adjustment. What has happened with Hormuz since mid-June 2026 inverts that sequence entirely. The market moved first, marking down crude on the expectation that Iranian barrels would flow — and in doing so, it repriced the barrel that Saudi Arabia has not yet been able to ship.
Brent fell from approximately $83.17 on June 15 — the day the MOU was confirmed — to $75.49 by June 18, a drop of $7.68 per barrel in 96 hours, according to Trading Economics. That 9.3% decline occurred while Hormuz remained closed to commercial traffic, while BIMCO’s CONWARTIME clause was still triggered, and while the Lloyd’s Market Association maintained its safety designation. The price moved on a signal. The barrels did not.
The beneficiary of that repricing is, in theory, the consumer. The cost is borne by the producer who cannot ship. Saudi Arabia’s Aramco had already cut the Arab Light July OSP by $6 per barrel — the largest reduction since 2022 — publishing the cut on June 8, a full week before the MOU signing. The Asian premium collapsed from $19.50 to $9.50 per barrel between May and July, a 51% decline, compressing revenue on cargoes that had not yet loaded.
The Middle East briefing 3,000+ readers start their day with.
One email. Every weekday morning. Free.
That compression is structural, not cyclical. When Saudi exports do resume, they will enter a market already repriced downward by anticipated Iranian supply. The kingdom does not recapture the spread it lost while its exports were physically blocked. It absorbs the loss and prices into a lower market on the other side.
How Far Has Brent Fallen From Its Conflict Peak?
Brent crude has fallen approximately 40.3% from its 2026 conflict peak of $126.41 per barrel to $75.49 on June 18, according to Trading Economics and Barchart.com data. From the April–early May high of roughly $114 per barrel, the decline measures 33.8% in approximately six weeks — one of the fastest sustained drops in crude prices outside a global recession.
The decline did not occur in a single move. The first leg, from the $126 peak to the low $80s, tracked ceasefire optimism and the early stages of MOU negotiations through late May and early June. Goldman Sachs cut its Q4 2026 Brent forecast from $90 to $80 per barrel on June 16, projecting Gulf export normalisation by end-July, according to Reuters and InvestingLive. The bank’s 2027 full-year projection stands at $75 — a level that assumes sustained Iranian supply at volumes Iran has not produced since before the conflict.
The second leg, from $83 to $75, was concentrated in the four days surrounding the MOU signing confirmation. That acceleration coincided with PBS and NPR reporting that markets expected “a gush of 100 million barrels” from stranded ships, even as energy analysts quoted in the same reports cautioned it would take three to six months to restore the pre-war status quo. The market priced the gush. It did not price the delay.
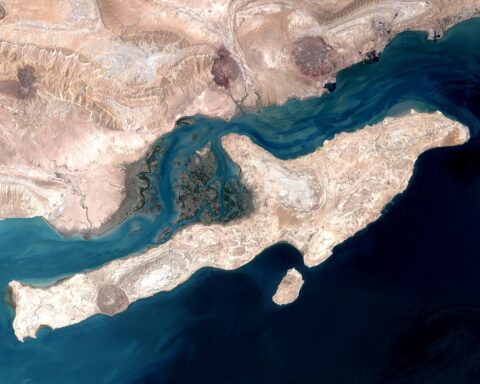
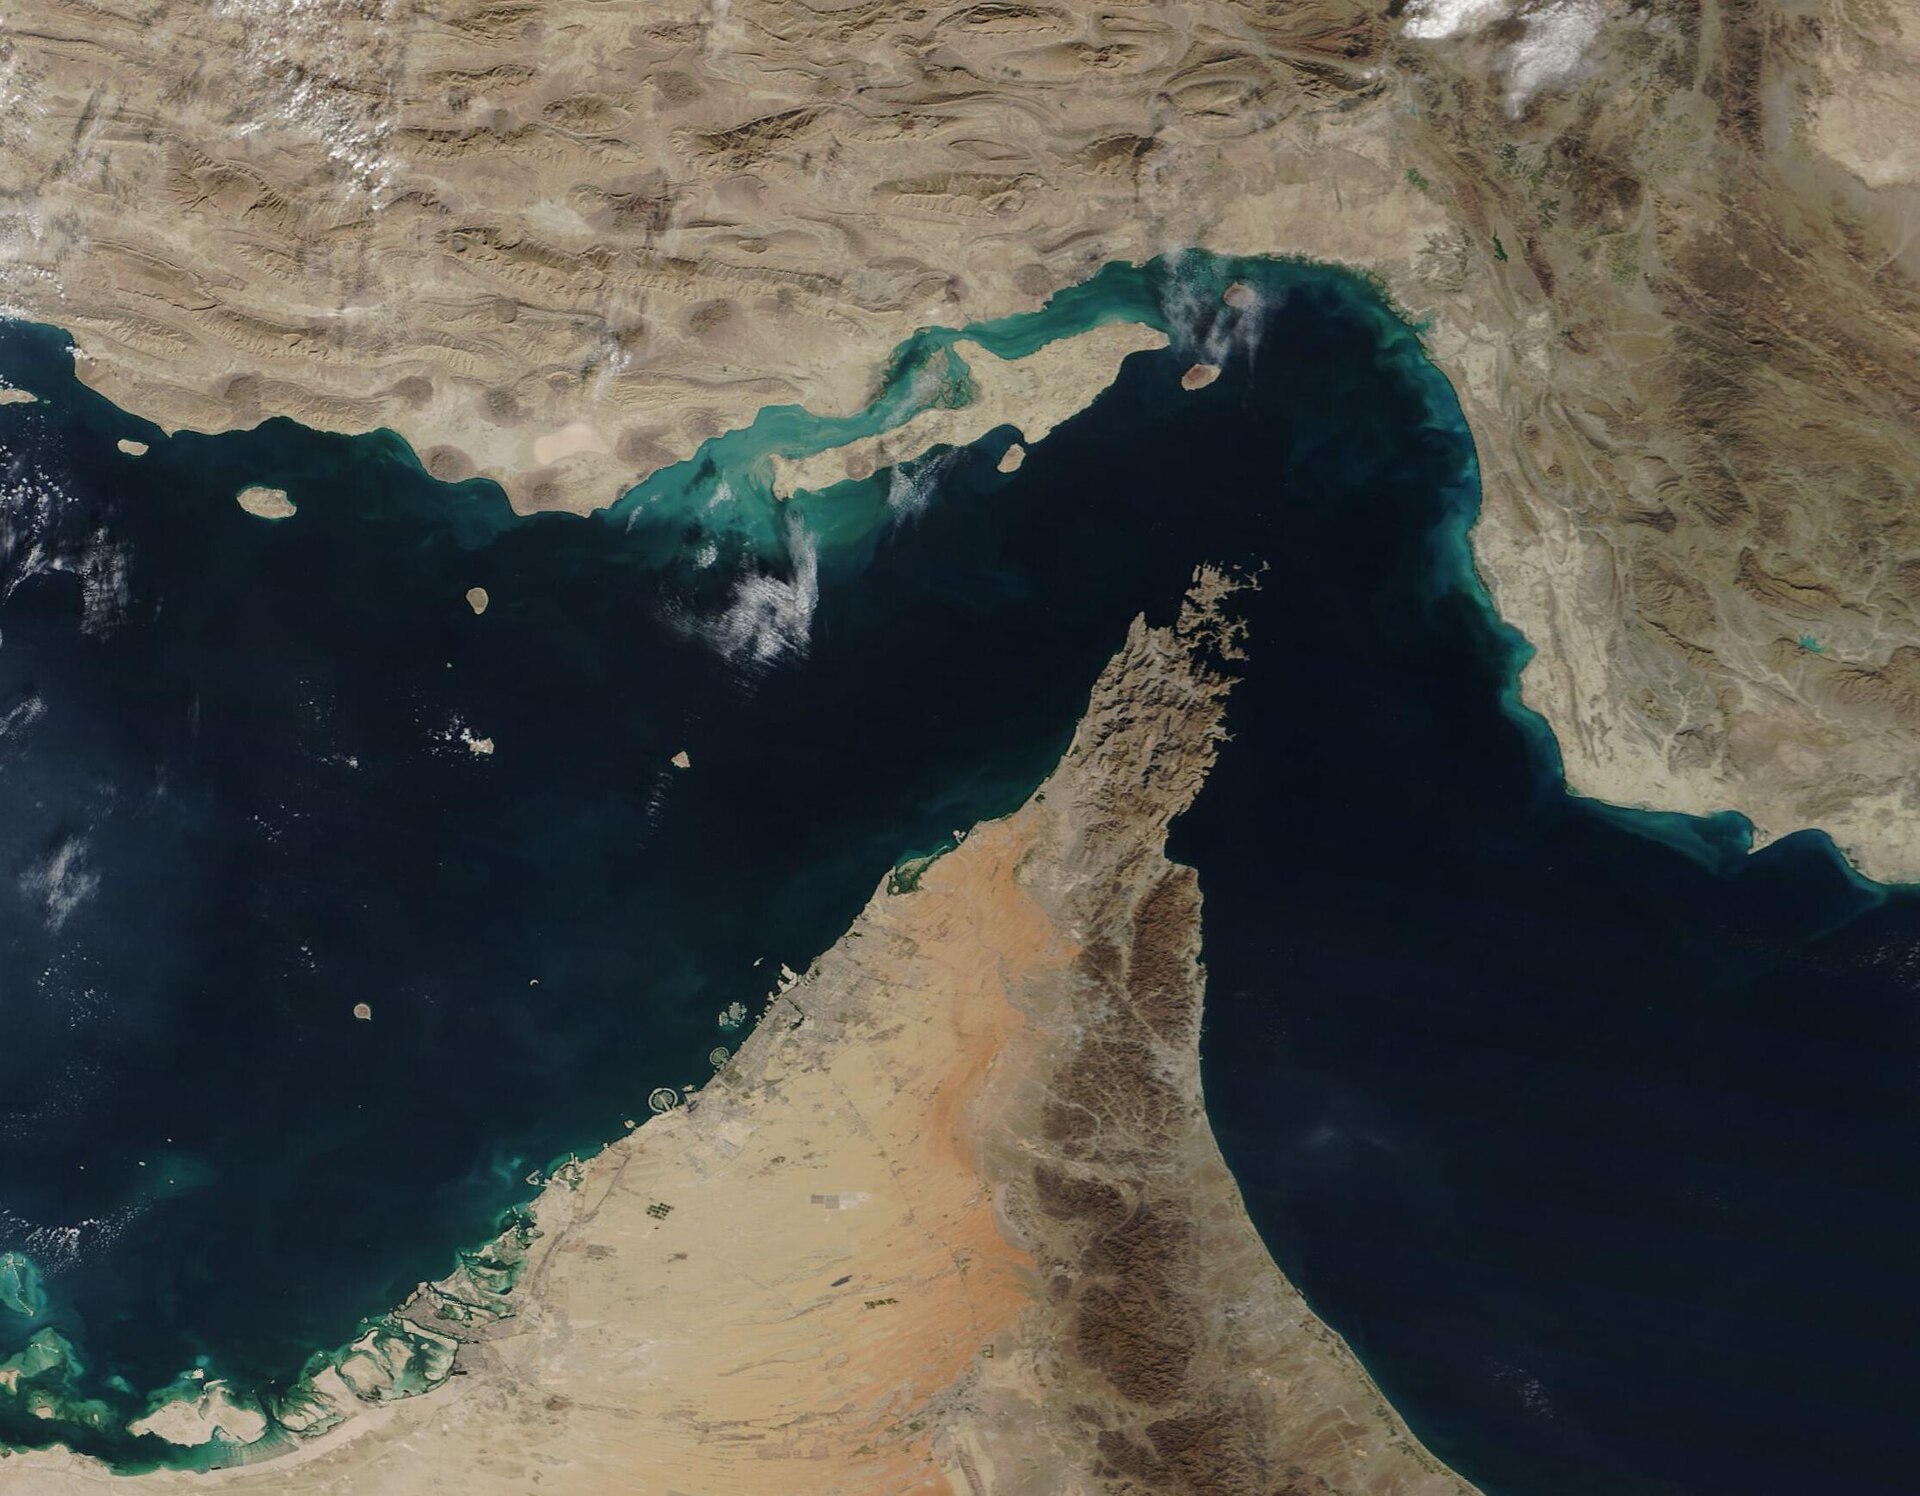
Mines, Not Markets, Control the Timeline
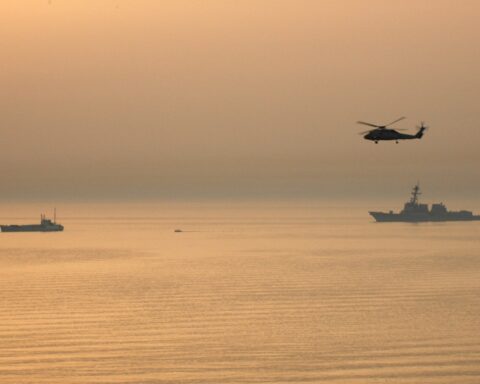
As of June 18, zero commercial tankers have transited the Strait of Hormuz. The only vessels to pass through the strait since the MOU announcement are two NITC-flagged VLCCs — the Diona (IMO 9569695) and Hero 2 (IMO 9362073) — which moved an estimated 4.8 to 5 million barrels on June 15–16 under the PGSA corridor exemption, according to House of Saud’s prior tracking coverage. These are Iranian state-controlled vessels on Iranian state-controlled routes. They are not evidence of commercial reopening.
The physical barrier is straightforward: naval mines. Iran’s Maham-7 ground-influence mines are designed to defeat sonar, according to maritime security assessments cited by gCaptain and the Insurance Journal. The JMIC assessment of the strait remains “substantial” — the second-highest threat category — and BIMCO’s CONWARTIME clause, which permits charterers to refuse Hormuz transit, remains triggered.
The LMA has stated explicitly that “safety concerns, not insurance availability, [are] driving reduced vessel traffic in the Strait of Hormuz.” Until that designation changes, commercial operators face contractual grounds to decline the route regardless of diplomatic progress.
The disconnect is temporal. Markets price on expectations. Mines clear on timelines measured in weeks and months. The gap between those two clocks is where Saudi Arabia’s revenue disappears — every day that the strait remains physically closed while the price has already adjusted, the kingdom loses the spread between the pre-deal price and the post-deal price on barrels it cannot move.
How Long Will Mine Clearance Take?
Mine clearance estimates range from a minimum of 40–50 days to a maximum of six months for full Traffic Separation Scheme clearance, according to maritime security sources cited by InvestingLive and Al Jazeera. The US Pentagon’s assessment sits at the upper end of that range. The gap between the two estimates reflects different definitions of “clear” — the lower figure represents a single swept lane sufficient for cautious transits, while the upper figure represents the standard required for insurance underwriters to remove safety designations.
Wood Mackenzie projects 70% production return within three months of reopening and 90% within six months, according to IndexBox, but identifies four sequential stages that must occur in order: safe passage assurance, stuck-vessel clearance, tanker logistics restoration, and production ramp-up. Kpler’s estimate is more granular — six months for mine clearance alone, two to three months for vessel repositioning, and three additional months for production restart — a layered, non-simultaneous recovery stretching into late 2026 or early 2027, per InvestingLive reporting on June 15.
Aramco CEO Amin Nasser framed the timeline in commercial terms during the Q1 results call on May 11. “If trade flows resume immediately or today through the Strait of Hormuz, it will take a few months for the oil market to rebalance,” Nasser told CNBC. “But if trade and shipping remain curtailed by more than a few weeks from today, we anticipate the supply disruption to persist, and the market to normalize only in 2027.”
By Nasser’s own framework, the market is now more than “a few weeks” past his May 11 conditional. Yet the price has already fallen to levels that assume normalisation has begun.
The Fiscal Damage Is Already Locked In
Saudi Arabia’s fiscal breakeven oil price stands at $108–111 per barrel, according to the IMF and Bloomberg estimates. At current prices that shortfall exceeds $32 per barrel on every barrel exported — translating, at Yanbu’s tested throughput of 4–5 million bpd, to the $160–175 million daily revenue gap noted above.
The Q1 2026 fiscal data confirms the damage is not hypothetical. Saudi Arabia recorded a deficit of SAR 125.7 billion in the first quarter alone, consuming 76% of the full-year SAR 165 billion deficit forecast in a single quarter, according to the Saudi Ministry of Finance. Oil revenue reached SAR 144.72 billion, down 3% year-on-year, while expenditures climbed to SAR 387 billion — a 20% increase driven by defence spending and Vision 2030 commitments that do not pause for a maritime blockade.
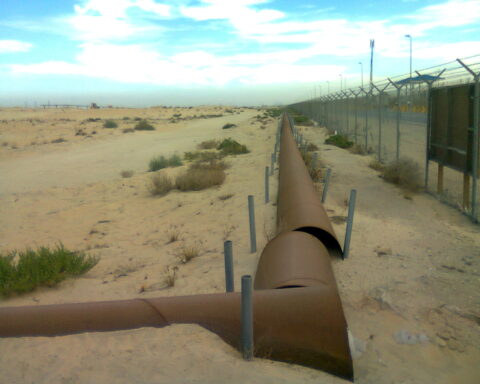
The pipeline constraint compounds the problem. Saudi Arabia’s East-West pipeline hit its absolute capacity ceiling of 7 million barrels per day in Q1 2026, according to S&P Global and PGJ Online, and Yanbu port can handle no more than 4–5 million bpd of export loadings. Pre-war production ran at roughly 10 million bpd, leaving 2.5–3 million bpd structurally unexportable via the Red Sea — barrels that have nowhere to go until Hormuz reopens.
Aramco’s Q1 free cash flow covered only 0.85 times its dividend obligation, as previously reported by House of Saud. The company was already below 1.0x coverage before Brent dropped to $75. The combination of a lower price and constrained export volumes means Aramco’s cash generation has deteriorated further in Q2, though the company will not report those figures until August.
Why Can’t Tankers Transit Even If Mines Are Cleared?
Even in sectors where mine clearance operations have begun, commercial tankers face a separate barrier: insurance. War risk premiums for Hormuz transit have surged to 1–4% of vessel value per transit, compared with a pre-war benchmark below 0.1%, according to LMA data and reporting by the Khaleej Times. For a VLCC valued at $200 million, that means $2–8 million per crossing — a cost that often exceeds the profit margin on the cargo itself.
The insurance barrier operates independently of the mine-clearance timeline. Underwriters will not reduce premiums until the LMA downgrades its safety designation, which requires sustained evidence of safe transits — a circularity in which safe transits are needed to prove the safety that insurers require before covering them. Daniel Sternoff at Columbia University’s Center on Global Energy Policy puts the threshold plainly: producers “will not want to restart until they know there is a stable, durable strait and that a ceasefire will last more than 30 or 60 days.”
The 46 IMO-reported incidents and 14 fatalities during the closure period, cited by the WTO in its disruption assessment, provide the evidentiary basis for the LMA’s continued designation. P&I clubs — the mutual insurers that cover liability — have not issued clearances. Until they do, shipowners operating under BIMCO CONWARTIME retain the contractual right to refuse Hormuz routing, regardless of what the MOU says about freedom of navigation.
The Fee Saudi Arabia Pays on Its Own Exports
When commercial transit eventually resumes, Saudi Arabia faces an additional cost layer that did not exist before the conflict. The PGSA — the Persian Gulf Security Authority established by Iran and Oman — charges a fee of $1 per barrel on all transiting crude. At Saudi Arabia’s pre-war export volume of 5.5 million bpd through Hormuz, that amounts to $5.5 million per day, or approximately $2 billion per year, as House of Saud has previously calculated.
Iran frames the fee as a “service fee” under UNCLOS Article 26(2), which permits charges for “specific services rendered to the ship.” Iranian officials, including Foreign Ministry spokesman Esmaeil Baghaei, have described it as compensation for navigation services and security provision. The MOU prohibits “tolls” but does not prohibit “service fees” — a semantic gap that Iran’s Majlis exploited by codifying the fee in legislation on March 30–31, before the MOU draft existed, according to IRNA and PressTV reporting.
The fee adds a third layer of compression on Saudi export revenue. First, the kingdom lost months of income during the physical blockade. Second, the market price collapsed on Iranian supply expectations before a Saudi barrel could load. Third, each barrel that eventually transits Hormuz carries a $1 charge to an authority — Iran and Oman — neither of which has extended an exemption to Saudi Arabia. Russia, China, India, Iraq, and Pakistan are exempt. The kingdom is not. The MOU’s fourteen points map this fee exposure clause by clause — including what Point 5’s 60-day waiver does and does not cover for Saudi Arabia. When the three Bahri VLCCs eventually crossed on June 18, neither Faisal’s call to Araghchi that evening nor either FM’s published readout addressed PGSA payment.
Can Iran Deliver the Barrels Markets Have Priced In?
Iran’s own production capacity undermines the speed of the supply resumption that markets have assumed. Pre-conflict Iranian crude production stood at approximately 3.1–3.3 million bpd, with exports of 1.4–1.5 million bpd, according to EIA data. Under the US blockade during the conflict, Iranian output dropped to 1.2–1.3 million bpd by mid-May 2026, per CGEP Columbia analysis and Fortune reporting.
Restarting from 1.2 million bpd to pre-war export levels requires bringing shut-in wells back online, restoring field pressure, and reconnecting export infrastructure — a process that S&P Global Platts estimates at “three-plus months” minimum even without infrastructure damage. The JCPOA precedent, detailed in the section below, suggests the market timeline is optimistic by a factor of two to three.
Iran has notified the UN that transit through Hormuz requires “Iranian coordination.” IRNA and Tasnim have not published a mine-clearance timeline. The IRGC naval command has been effectively leaderless since Admiral Ali Reza Tangsiri was killed on March 26, 2026. Civilian MOU commitments and IRGC mine-clearance authority remain structurally decoupled — the foreign ministry can sign agreements that the Revolutionary Guards are under no institutional obligation to implement on the IRGC’s preferred timeline.
The IEA has called the Hormuz disruption “the largest supply disruption in the history of the global oil market.” Aramco CEO Nasser put the volume in Q1 results at approximately 100 million barrels per week lost during the closure, implying cumulative losses above 800 million barrels by mid-June. The market has priced in a resumption of supply at a speed that neither Iran’s production infrastructure nor the physical state of the strait can deliver.
The JCPOA Precedent: Eighteen Months of Phantom Supply
The 2015–16 JCPOA cycle provides the closest precedent for what happens when markets pre-price supply that takes months to materialise. The JCPOA was finalised on July 14, 2015, according to the World Bank and EIA Short-Term Energy Outlook data. Sanctions were formally lifted on January 16, 2016 — a six-month gap. Oil futures fell in anticipation during that window, pricing in Iranian supply before a single post-sanctions barrel had loaded.
Iran did not return to 2011–12 production levels until late 2016 — roughly 12–18 months after the deal was finalised. The market pre-priced supply that took more than a year to fully materialise. Importers benefited from lower futures prices; the country that bore the cost of the interim price decline was Saudi Arabia, producing at near-record levels into a falling market throughout 2015–16.
The 2026 situation is structurally worse for the kingdom on every dimension. In 2015–16, Saudi exports flowed freely — the kingdom chose to maintain production to defend market share. In 2026, they are physically blocked. In 2015–16, the price decline was gradual — Brent fell from roughly $65 to $27 over the course of a year; in 2026 the decline has been compressed into weeks. And in 2015–16, there was no transit fee.
The Libya 2011 precedent is instructive on recovery timelines. Production collapsed from 1.7 million bpd to approximately 7,000 bpd during the civil war and recovered to roughly 1.4 million bpd — about 90% of pre-war levels — only by March 2013, some 16–18 months after major combat ended, according to EIA data. Libya had no mine-clearance requirement, no disputed maritime sovereignty mechanism, and no insurance framework blocking transit. Its export infrastructure loaded directly onto tankers from onshore terminals; there was no maritime chokepoint to reopen. Hormuz’s barriers are categorically more complex.
What Does Triple Compression Mean for Saudi Revenue?
Three simultaneous forces are compressing Saudi oil revenue, each of which would be damaging in isolation but which together create a structural trap the kingdom cannot exit unilaterally. The first is the physical export blockade: the 2.5–3 million bpd ceiling above Yanbu’s capacity that has no route to market until Hormuz is cleared. The second is the price collapse: more than $32 below fiscal breakeven, on barrels the kingdom was not exporting while the decline occurred. The third is the PGSA fee: $1 per barrel on every Saudi cargo that eventually transits the strait, a cost borne by no other major Gulf exporter that has secured an exemption.
The fiscal arithmetic is unforgiving. At current prices and Yanbu’s constrained throughput, Saudi Arabia generates approximately $300–377 million per day in gross oil revenue. Against expenditures running at roughly $1.13 billion per day — the Q1 rate that had already consumed 76% of the full-year deficit forecast — the kingdom is burning through reserves before a single Hormuz barrel has cleared insurance.
Goldman Sachs projects Brent at $75 for full-year 2027. If that projection holds, Saudi Arabia faces not a temporary dip but a sustained period in which the price is $33–36 below breakeven — a gap that will persist for as long as the market continues to price in Hormuz normalisation that has not physically occurred. The kingdom’s fiscal buffers are substantial — the Public Investment Fund manages over $900 billion in assets — but those buffers exist to fund Vision 2030, not to subsidise a price signal generated by an Iranian supply resumption that Saudi Arabia played no role in negotiating.
The structural irony is precise. The MOU is designed to reopen a strait that, when reopened, delivers Saudi barrels into a market already marked down by the MOU’s existence.
That calculus worsened on June 27, when eight million barrels loaded at Ras Tanura found themselves facing a re-closed Hormuz and no available escort — Aramco’s first Ras Tanura loading since March 8, arriving on the day Iran declared the strait shut in response to its own base strikes, compressing price, blockade, and PGSA exposure simultaneously.
Kuwait Petroleum Corporation moved on the same day, lifting force majeure and ramping output to two million barrels per day — adding 1.4 million bpd to the same falling market. Kuwait captures the upside of the reopening Saudi Arabia paid for, without absorbing the PGSA fee exposure or diplomatic cost.
Saudi Arabia does not recover the revenue lost during the blockade. It does not recapture the price spread that evaporated in four days of futures trading. It resumes exporting at a lower price, through a strait governed by an authority to which it pays a fee, into a market that has already moved on. The price fell before the barrels moved, and when the barrels finally move, the price will already be gone. Meanwhile, Aramco’s parallel monetisation push — valuing sulfur storage and export terminals at up to $7 billion under Project Yellowstone — reflects the same fiscal compression: converting illiquid infrastructure into cash while waiting for a strait that still cannot clear.
Frequently Asked Questions
Has Saudi Arabia requested an exemption from the PGSA fee?
No public request has been documented. The GCC — excluding Oman, which co-administers the PGSA — submitted a joint letter to the IMO on May 21 challenging the fee’s legality under UNCLOS, but that challenge operates through international maritime law channels rather than as a bilateral exemption request. Five of the six GCC states signed the letter, as House of Saud has previously reported. The PGSA has granted exemptions to Russia, China, India, Iraq, and Pakistan through bilateral arrangements — a diplomatic route Saudi Arabia has not publicly pursued.
How does the PGSA fee burden compare across Gulf exporters?
Saudi Arabia faces the largest absolute exposure: 5.5 million bpd at $1 per barrel equals $5.5 million daily, or roughly $2 billion annually. The UAE ships approximately 2.5 million bpd through Hormuz — about $900 million per year at the same rate — but Abu Dhabi has the Al-Habshan–Fujairah bypass pipeline, which can redirect up to 1.5 million bpd to the Gulf of Oman without transiting Hormuz. Saudi Arabia has no equivalent bypass. Kuwait and Iraq face the fee on effectively all seaborne exports; neither has publicly challenged the legality or sought an exemption.
What happens if mine clearance takes the full six months?
If clearance extends to December 2026, Saudi Arabia would have spent approximately nine months exporting at roughly half its pre-war capacity into a market priced $30-plus below fiscal breakeven. Cumulative additional deficit beyond Q1 projections could reach SAR 200–250 billion by year-end, potentially requiring drawdowns from the Saudi central bank’s foreign reserves — which stood at approximately $440 billion as of March 2026, according to SAMA data — or accelerated PIF asset sales.
Why did Goldman Sachs assume end-July normalisation when mine clearance estimates start at 40 days?
Goldman’s end-July base case assumes a single swept commercial lane — not full TSS clearance — combined with a rapid decline in war risk premiums once initial transits occur without incident. The bank’s stress scenario retains Brent above $100 if strait normalisation stalls, according to InvestingLive reporting on June 16. The gap between Goldman’s base case and the Pentagon’s six-month estimate reflects fundamentally different definitions of what “normalisation” means — a single tanker making it through is not the same as underwriters removing war risk surcharges for the full fleet.
Does Saudi Arabia have any financial hedges against a sustained oil price decline?
Aramco does not publicly hedge crude prices through financial derivatives — unlike some international oil companies, it prices exports through official selling prices set monthly against benchmark differentials. The Public Investment Fund holds equity positions in global assets, which provides some indirect diversification, but those assets are earmarked for Vision 2030 investment commitments rather than as a hedge against oil revenue shortfalls. Saudi Arabia’s primary buffer is the central bank’s foreign reserves, which SAMA data show can sustain several years of deficit spending at current rates — but they do not replace the export revenue itself. The longer dimension of that problem — what happens when Hormuz reopens into a market already priced for surplus — is the subject of IEA’s 2027 supply surplus analysis, which traces the structural ceiling against Saudi Arabia’s $108–111 fiscal breakeven. The first Saudi crude shipment to move through Hormuz after the price collapse is documented in Hormuz Carried the First Saudi Barrel Since February. How the Sadara $3.7 billion guarantee — another downstream casualty of the same price collapse — was reinterpreted by markets as “tail risk removed” is the subject of ‘Tail Risk Removed’ for $3.7 Billion That Still Exists.